

Amazon.com, Inc. (AMZN 0.00%↑) reported Q3 2026 results on October 29, 2026. AWS accelerated for a sixth straight quarter, to 39.3% year over year (YoY). CEO Andy Jassy now says it can become a trillion-dollar revenue business within five to ten years. Revenue rose 12.1% to $201.9 billion, about 4 points below its underlying pace because Prime Day moved into Q2 this year. Operating income reached $28.1 billion, a 13.9% margin and Amazon’s highest ever. Trailing twelve months (TTM) operating cash flow (OCF) grew 28.8% to $168.3 billion. At $267, the stock trades at 17.5x TTM OCF.
Jassy made the trillion-dollar claim in writing in the earnings release and then again on the call:
“There has never been a business with a trillion dollars of annual revenue. Amazon is on a path to have two of them in AWS and stores.”
The claim is worth testing, because over the twelve months to September 30 the two candidates sat at opposite ends of the distance to a trillion. The North America and International segments (stores) earned $636.1 billion of revenue together, 64% of the way, and AWS earned $161.4 billion, or 16%. Operating income runs in the opposite order: AWS made $61 billion, and the two retail segments $43.3 billion together.
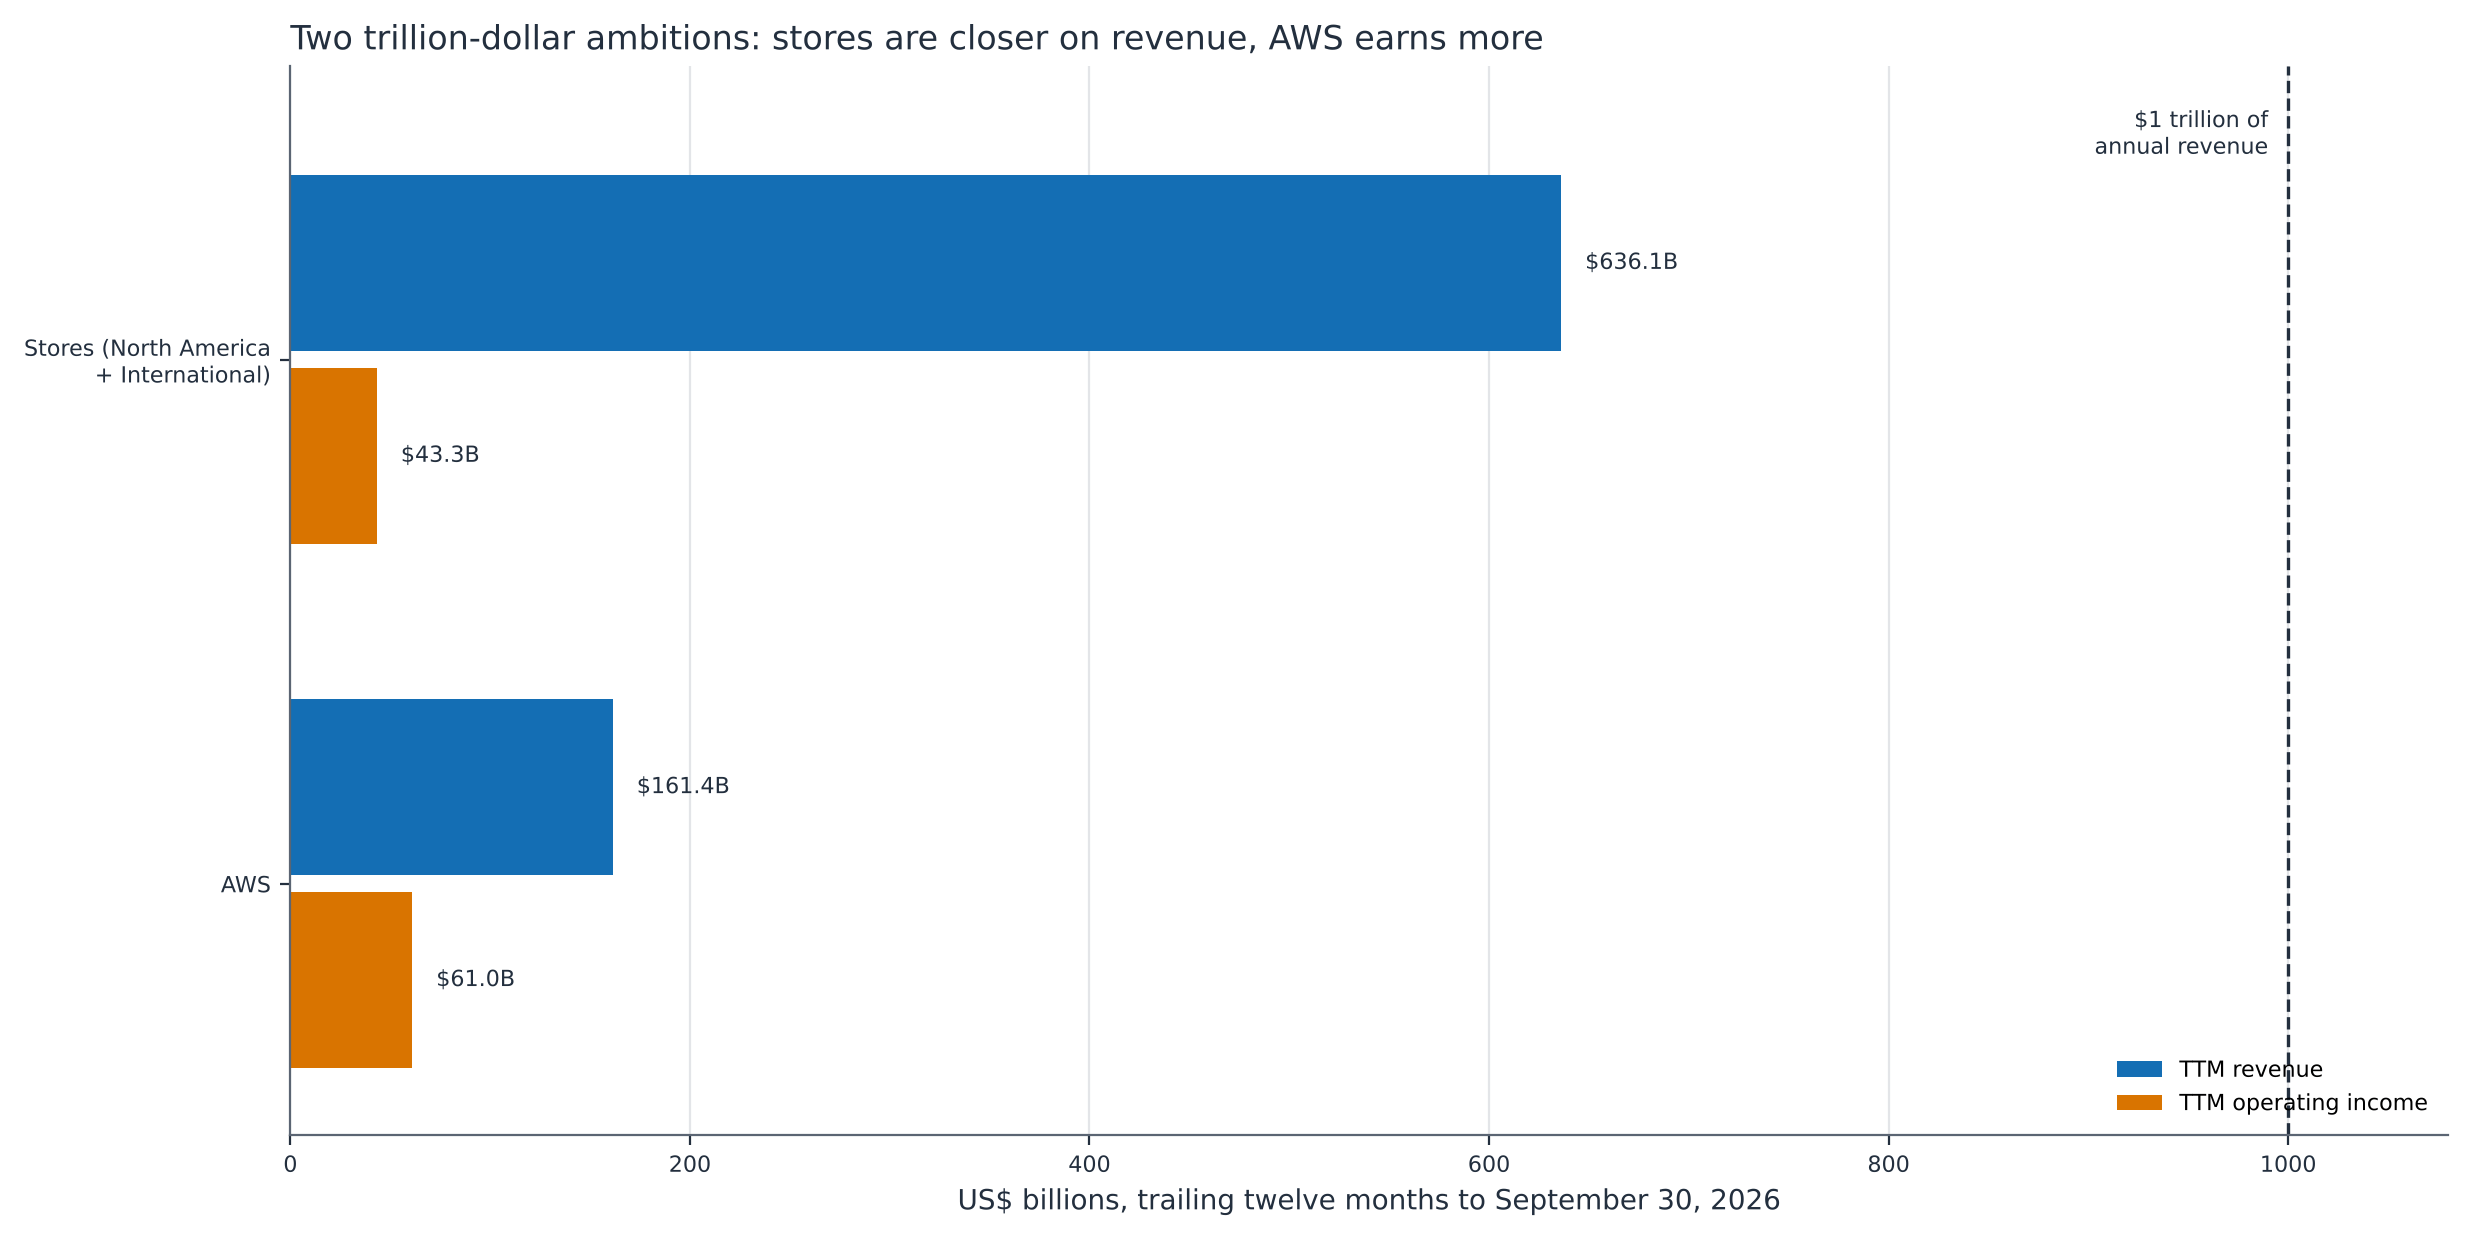
The stores trillion comes first, as a revenue milestone. Across Q2 and Q3 combined the two segments grew 10.7%, and at that rate the trillion arrives in 4.5 years. The AWS trillion is where the value sits, at a 38.7% margin. Q3 says that bet is on schedule. AWS held its operating margin, and Jassy now gives visibility into 2029. Debt keeps funding part of the gap between OCF and CapEx. That gap closes as the data centers built this year start billing, about two years out.

Q3 2026 highlights
Revenue grew 15.7% excluding the Prime Day shift: the release gives 12% growth and puts the Prime Day effect at roughly 4 points. Pairing Q2 with Q3 removes the shift altogether. On that basis revenue grew 15.7% YoY, from $347.9 billion to $402.6 billion for the six-month period.
Operating income grew 28.8% on a clean basis, to a record 13.9% margin: reported operating income rose 61%, from $17.4 billion to $28.1 billion. That comparison flatters the quarter. Q3 2025 carried a $2.5 billion FTC settlement and $1.8 billion of severance, and without them it was $21.7 billion, per the Q3 2025 earnings release. Q3 2026 includes a $91 million unrealized gain on energy contracts. Excluding both, operating income grew 28.8%, from $21.7 billion to $28 billion (derived). TTM operating income reached $104.4 billion, a 13.1% margin.
AWS grew 39.3% to $46 billion, a sixth straight acceleration: that’s the fastest growth in nearly five years, at a $184 billion annualized run rate. Operating income rose 55.4% to $17.8 billion, a 38.7% margin. That’s above the 34.6% reported a year ago.
The shipping spread turned positive again: shipping costs rose 11% to $28.3 billion against 12% growth in paid units. CFO Brian Olsavsky said shipping costs grew 8% excluding fuel and line-haul inflation. In Q2 the spread had inverted to -2 points.
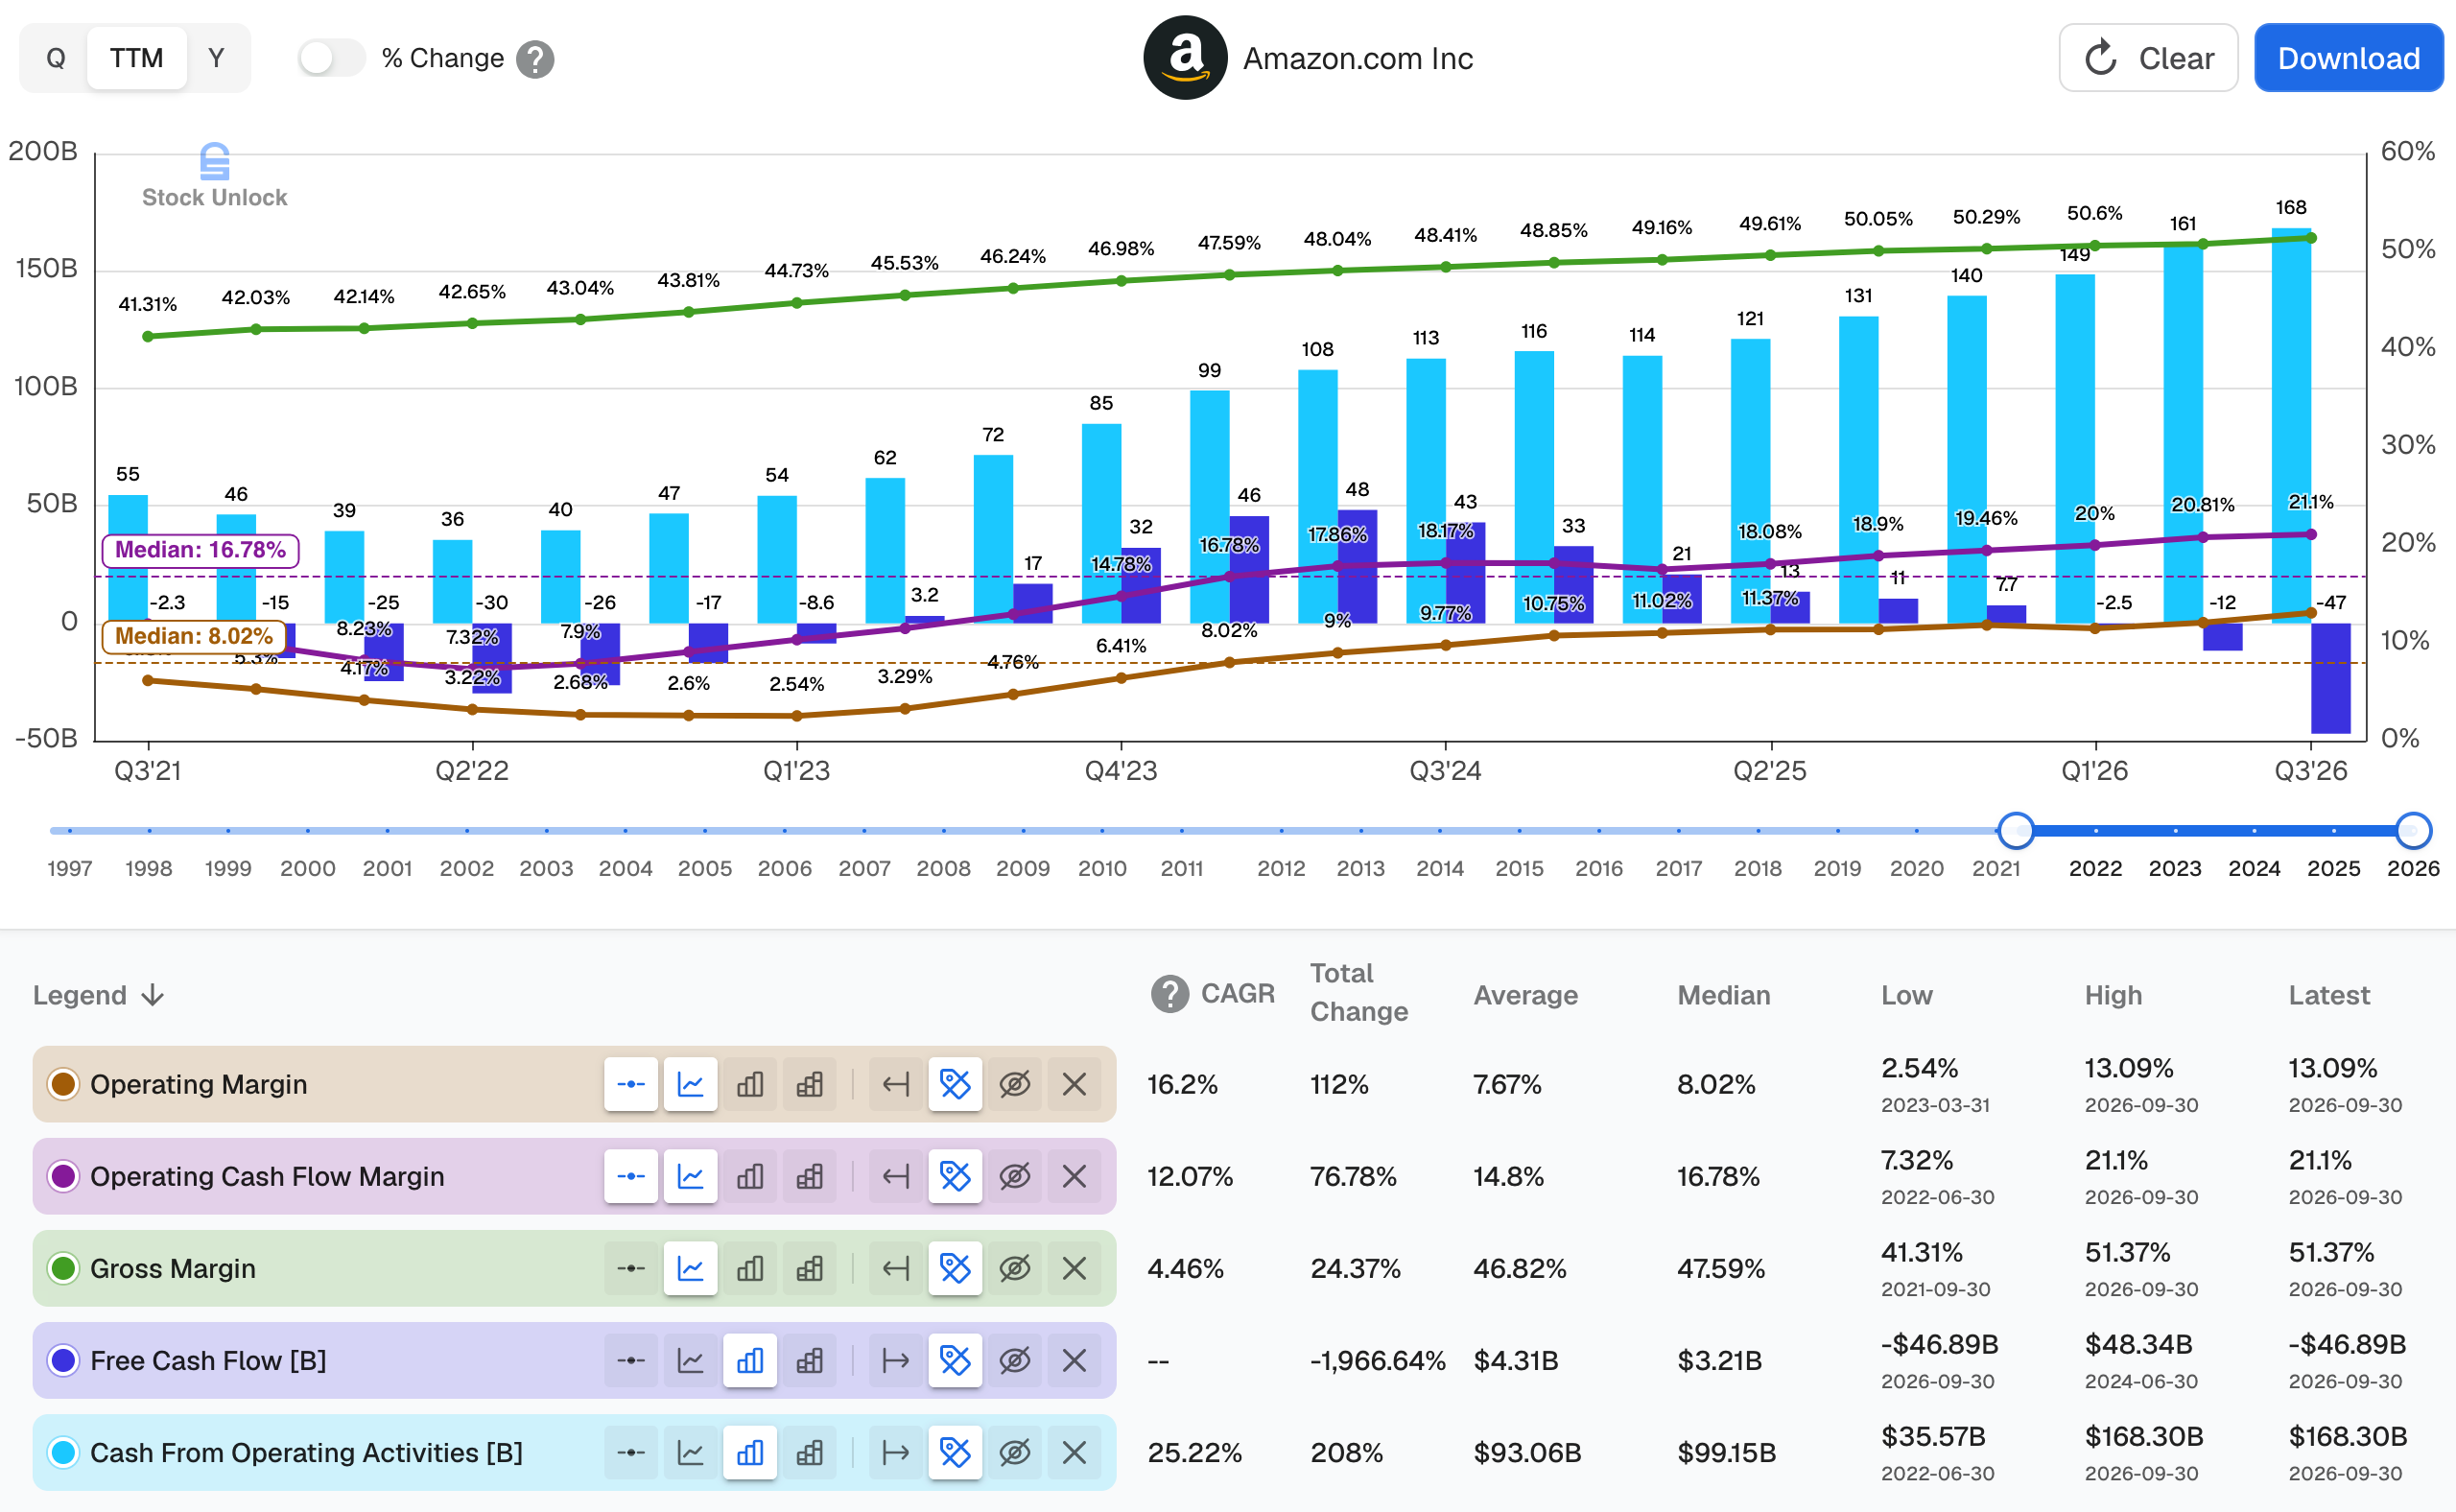
TTM operating cash flow (OCF) grew 29% to $168.3 billion: that’s 21.1% of TTM revenue of $797.5 billion. It’s above the 20.8% margin I called a record in Q2. OCF is the line I value Amazon on, and it rose $37.6 billion in a year.
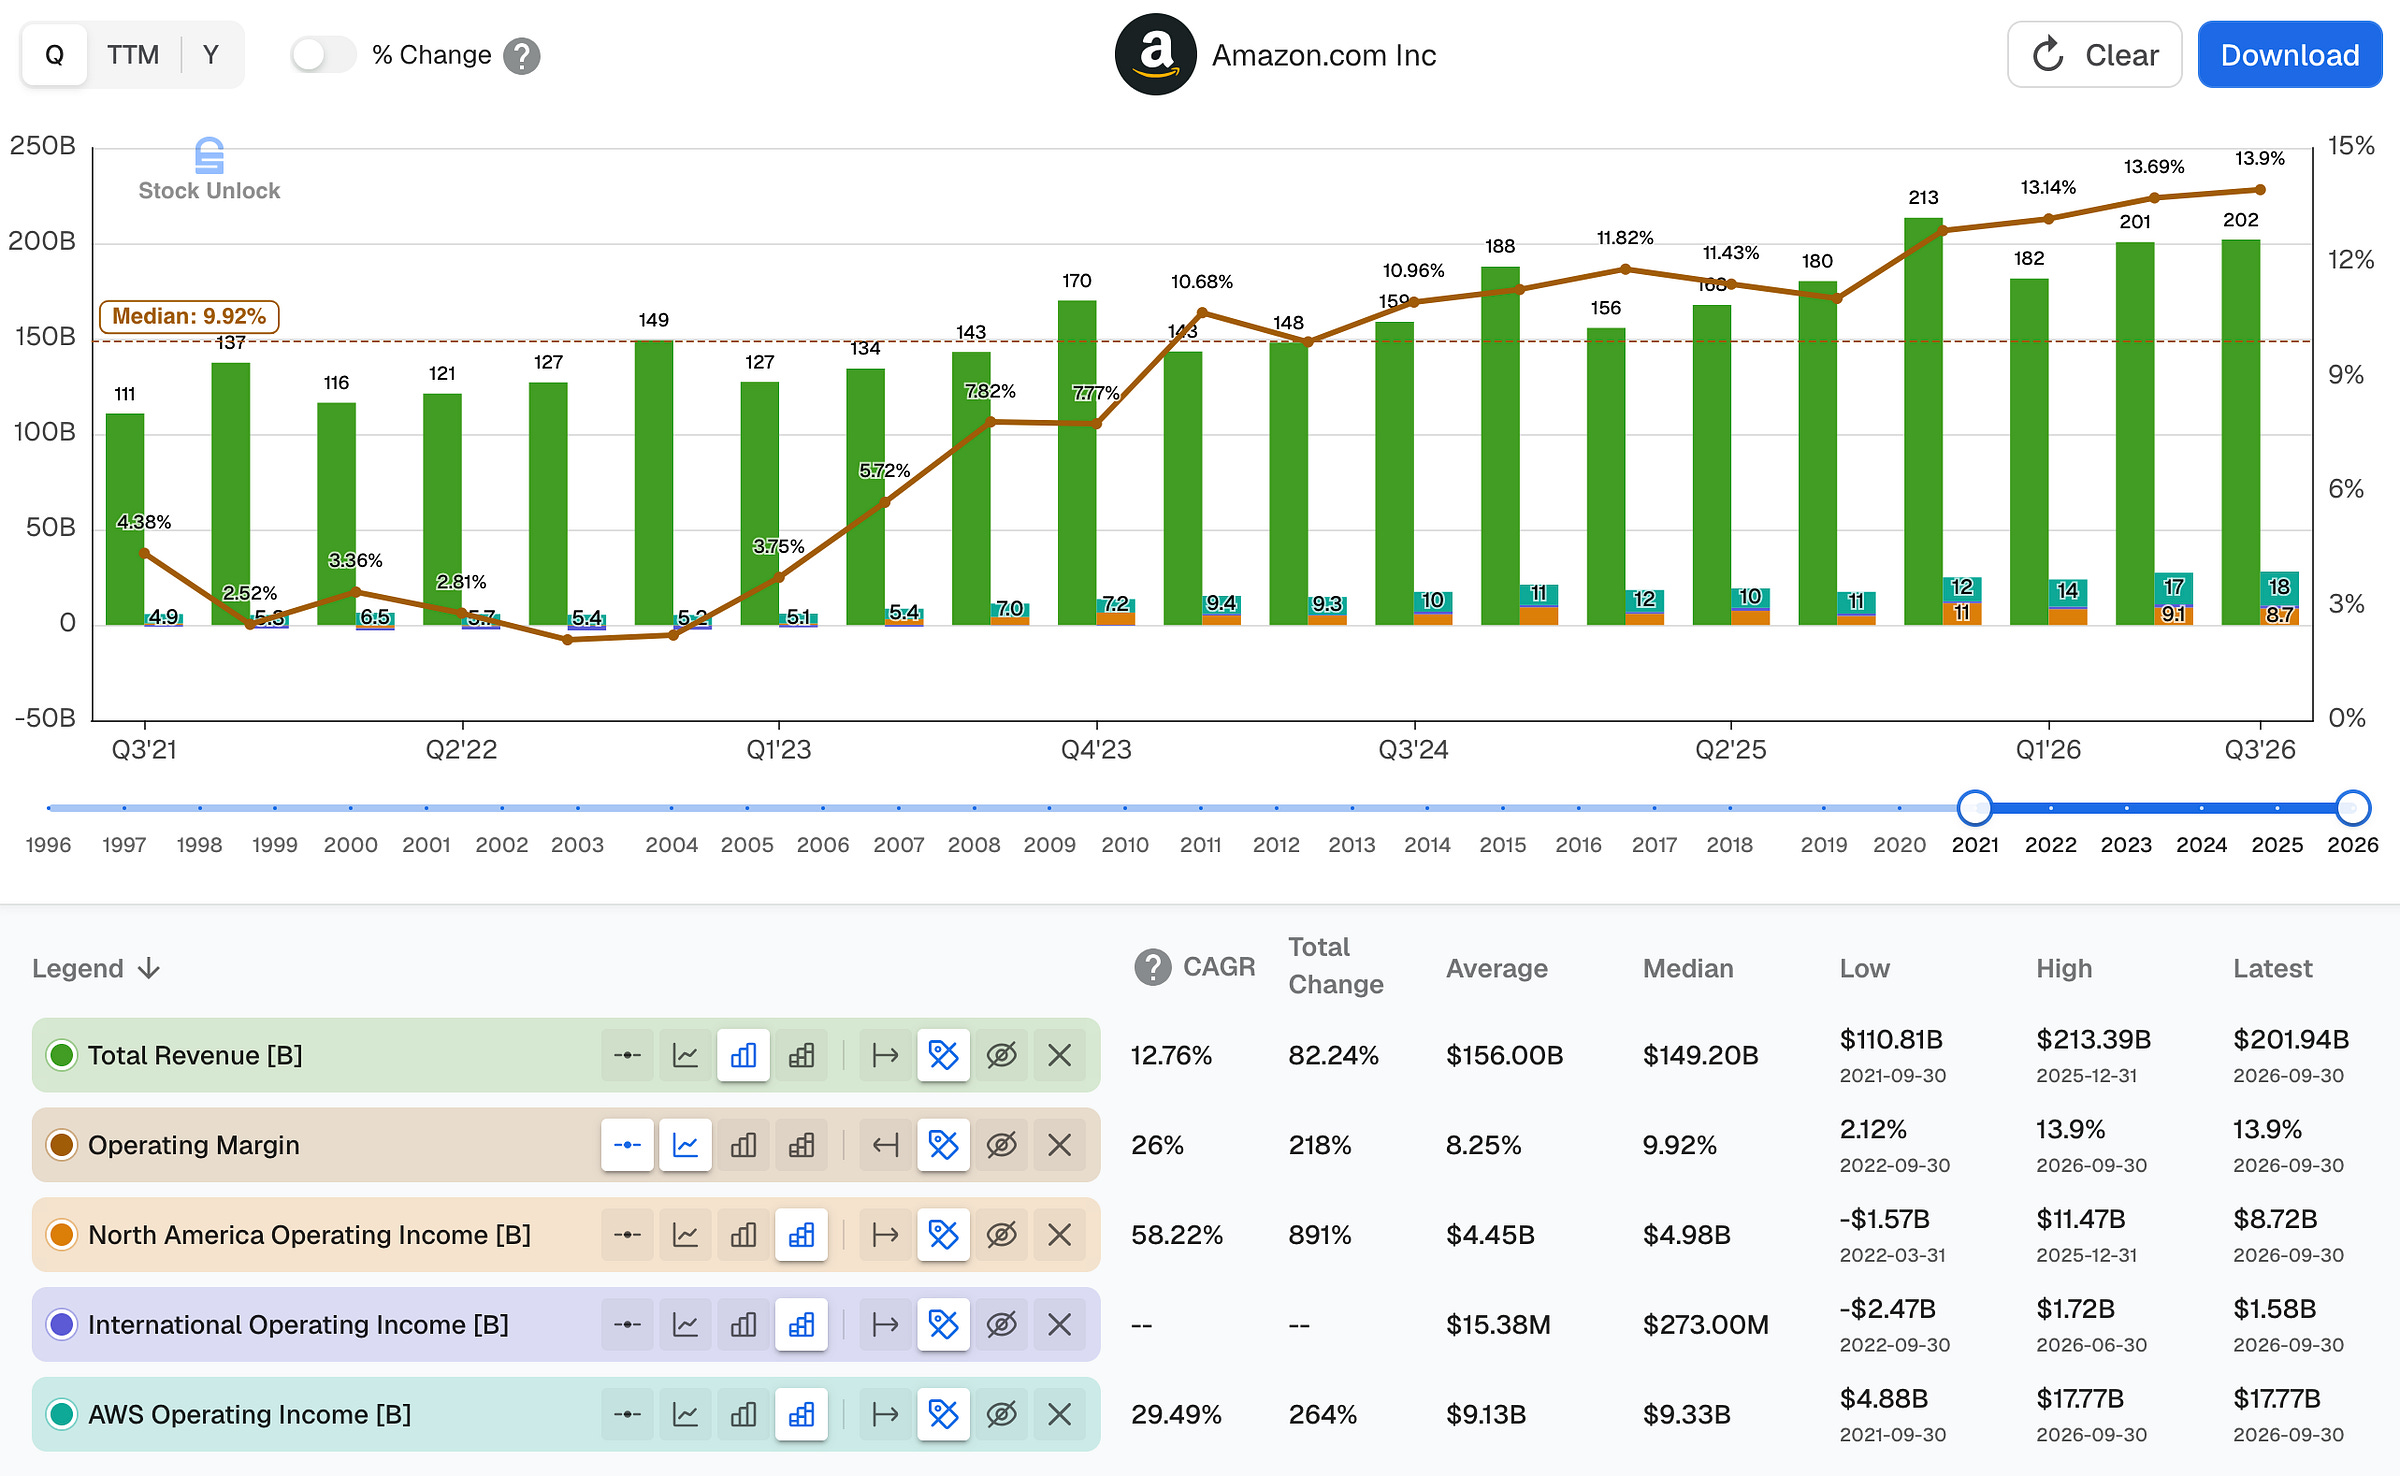
Revenue, segment operating income and consolidated operating margin, Q3 2021 to Q3 2026. The margin reached a record 13.9%, and AWS earned $17.8 billion against $8.7 billion for North America
Q3 2026 lowlights
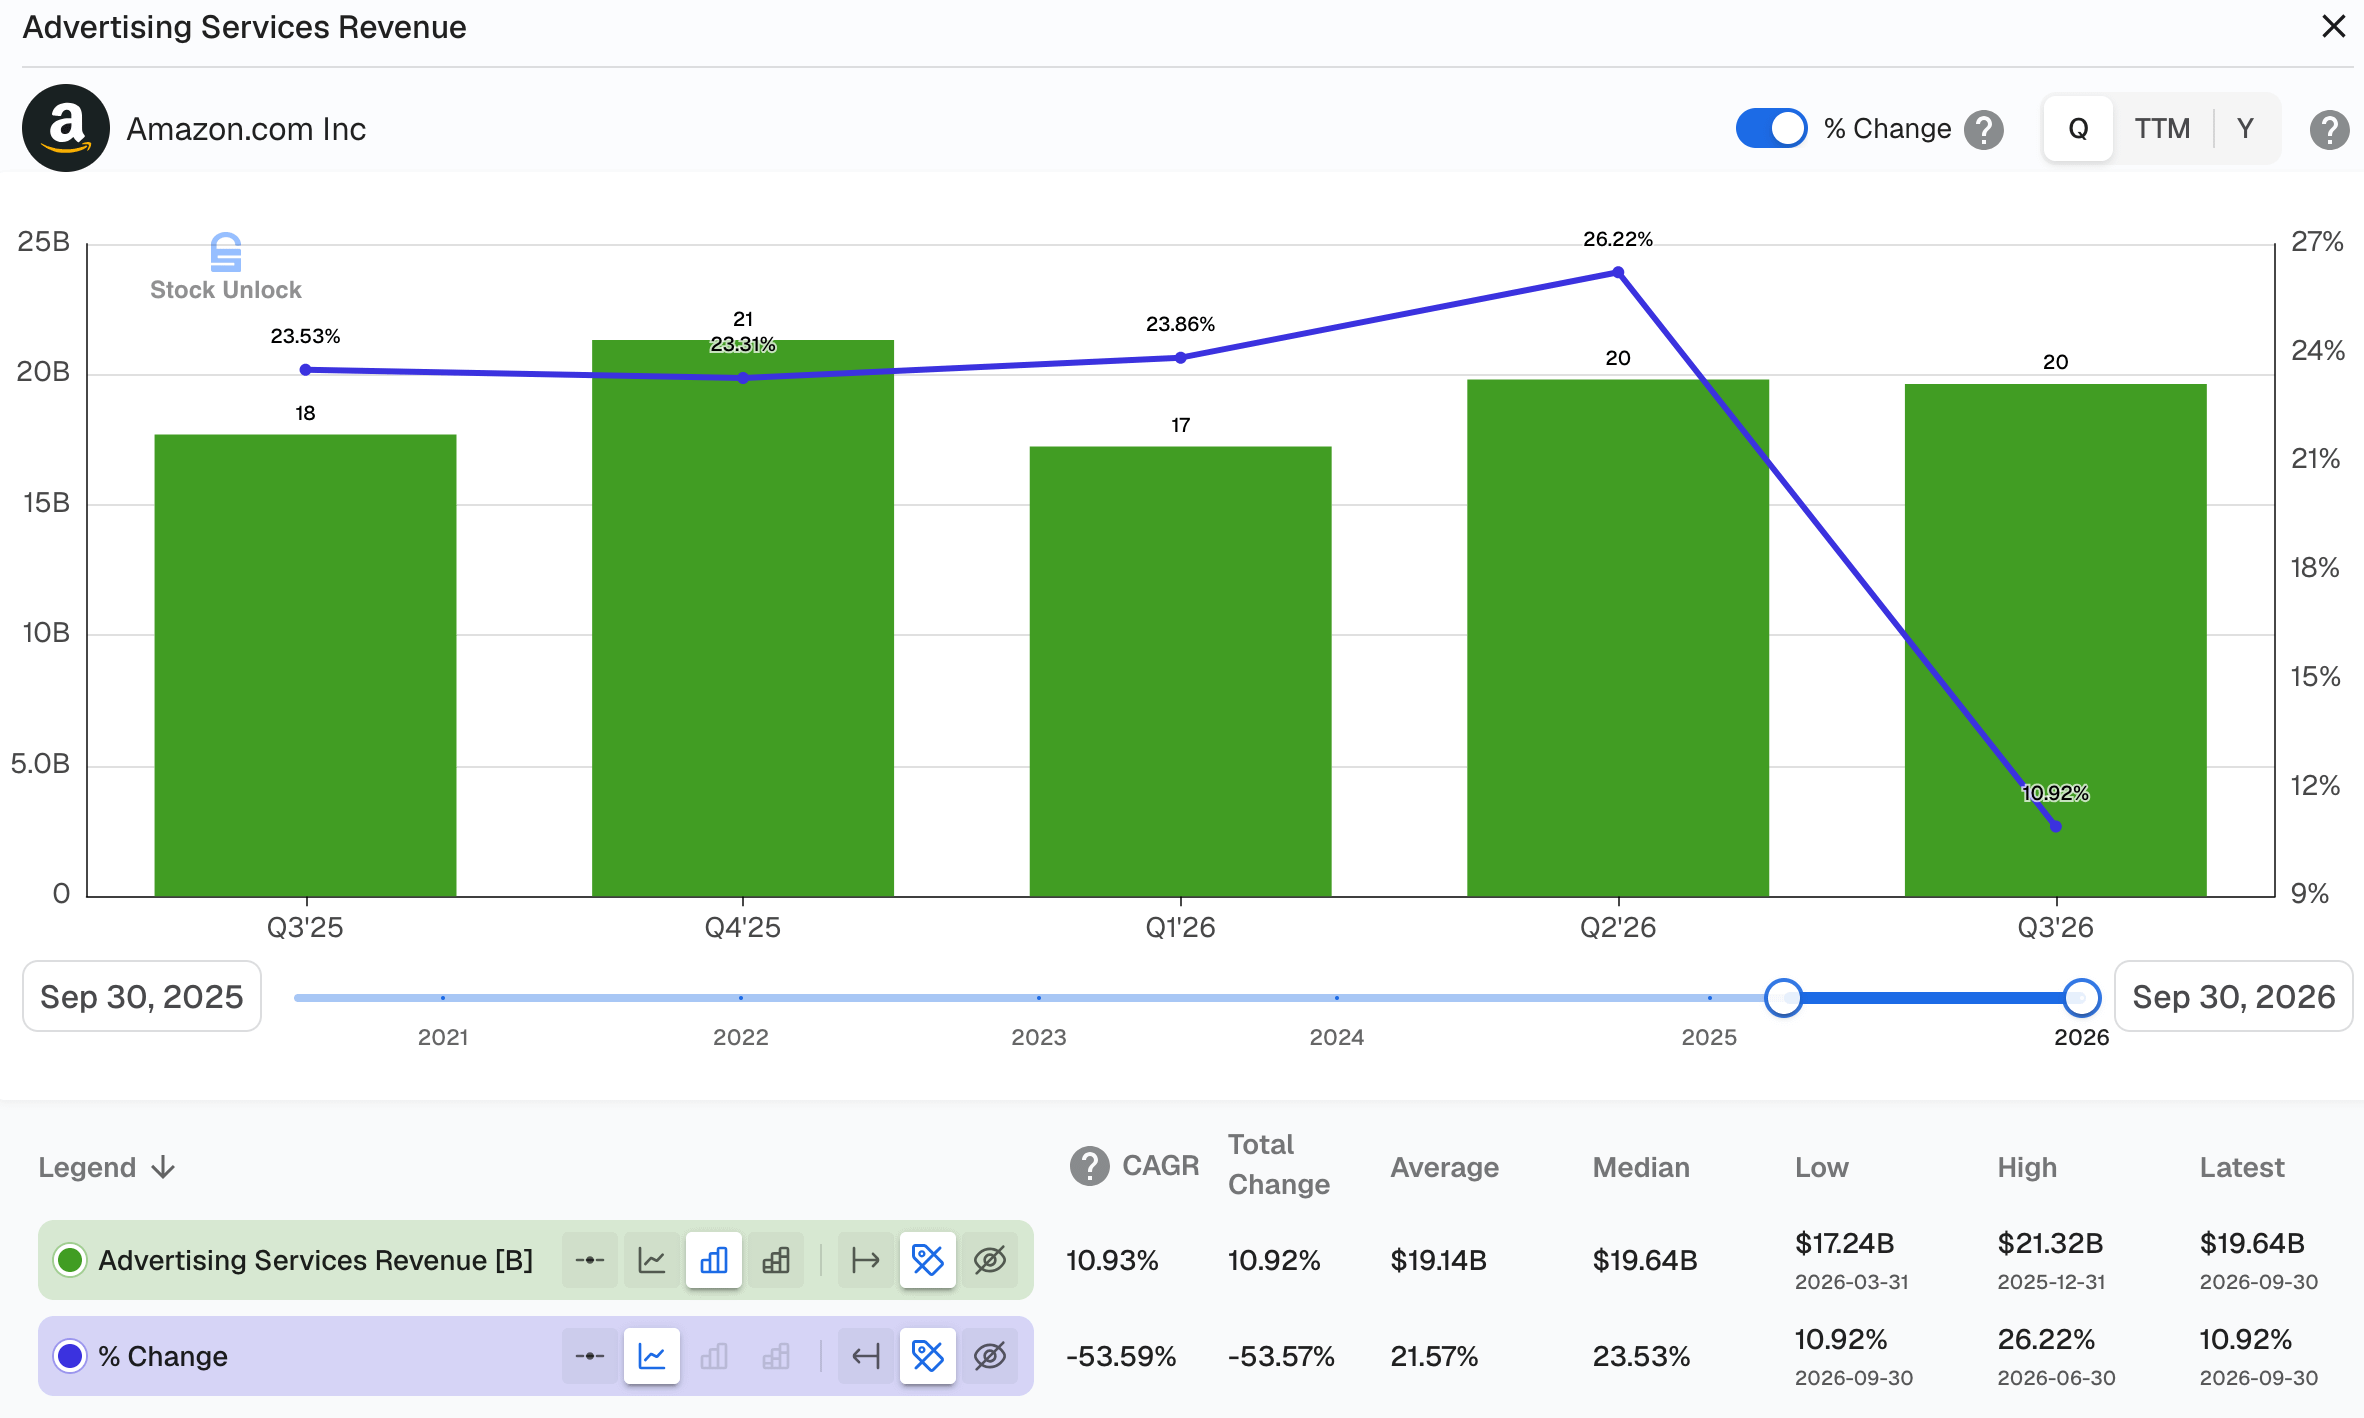
Advertising slowed to 10.9%, and not only because of timing: revenue was $19.6 billion, up 11% YoY. Jassy attributed 8.5 points of the slowdown to Prime Day. Pairing Q2 with Q3 to remove the shift, advertising grew 18.1% YoY. Part of the deceleration is real.
Q3 operating cash flow grew 19.4%: it rose from $35.5 billion to $42.4 billion. TTM growth slowed from 33.2% in Q2 to 28.8%. Operating profit kept rising, but $8.4 billion of cash went into inventory Amazon hasn’t sold yet and into paying bills for costs it had already booked, against $2.8 billion a year earlier.
Free cash flow (FCF) fell further, and debt filled the gap: Q3 FCF was -$33.5 billion, taking TTM FCF to -$42.4 billion, and long-term debt rose from $128.9 billion in Q2 to $173.1 billion.
AWS added less revenue sequentially: Q3 AWS revenue rose $3.8 billion over Q2, against $4.6 billion in Q2 over Q1.
AWS is the trillion worth building
Jassy put a growth rate on AWS two years out:
“we believe that AWS can grow north of 40% in each of 2027 and in 2028 and be a trillion-dollar revenue business in the next five to ten years.”
What supports a forecast that long? Capacity reservations. Jassy said the largest customers reserve capacity in blocks of hundreds of megawatts, up to a gigawatt, well in advance:
“We have very good visibility into 2027 and 2028 and some of 2029 too, with respect to what customers want in those really big chunks of capacity.”
That visibility is the $578 billion backlog, which I examined in who is behind the $578 billion AWS backlog?. Two AI labs signed 42.9% of it, with their commitments running seven to ten years. Spread evenly over those terms, they come to about $28.9 billion a year, or 15.7% of AWS’s $184 billion run rate. The 40% guide for 2027 and 2028 leans on the two labs far less than their share of the backlog suggests.

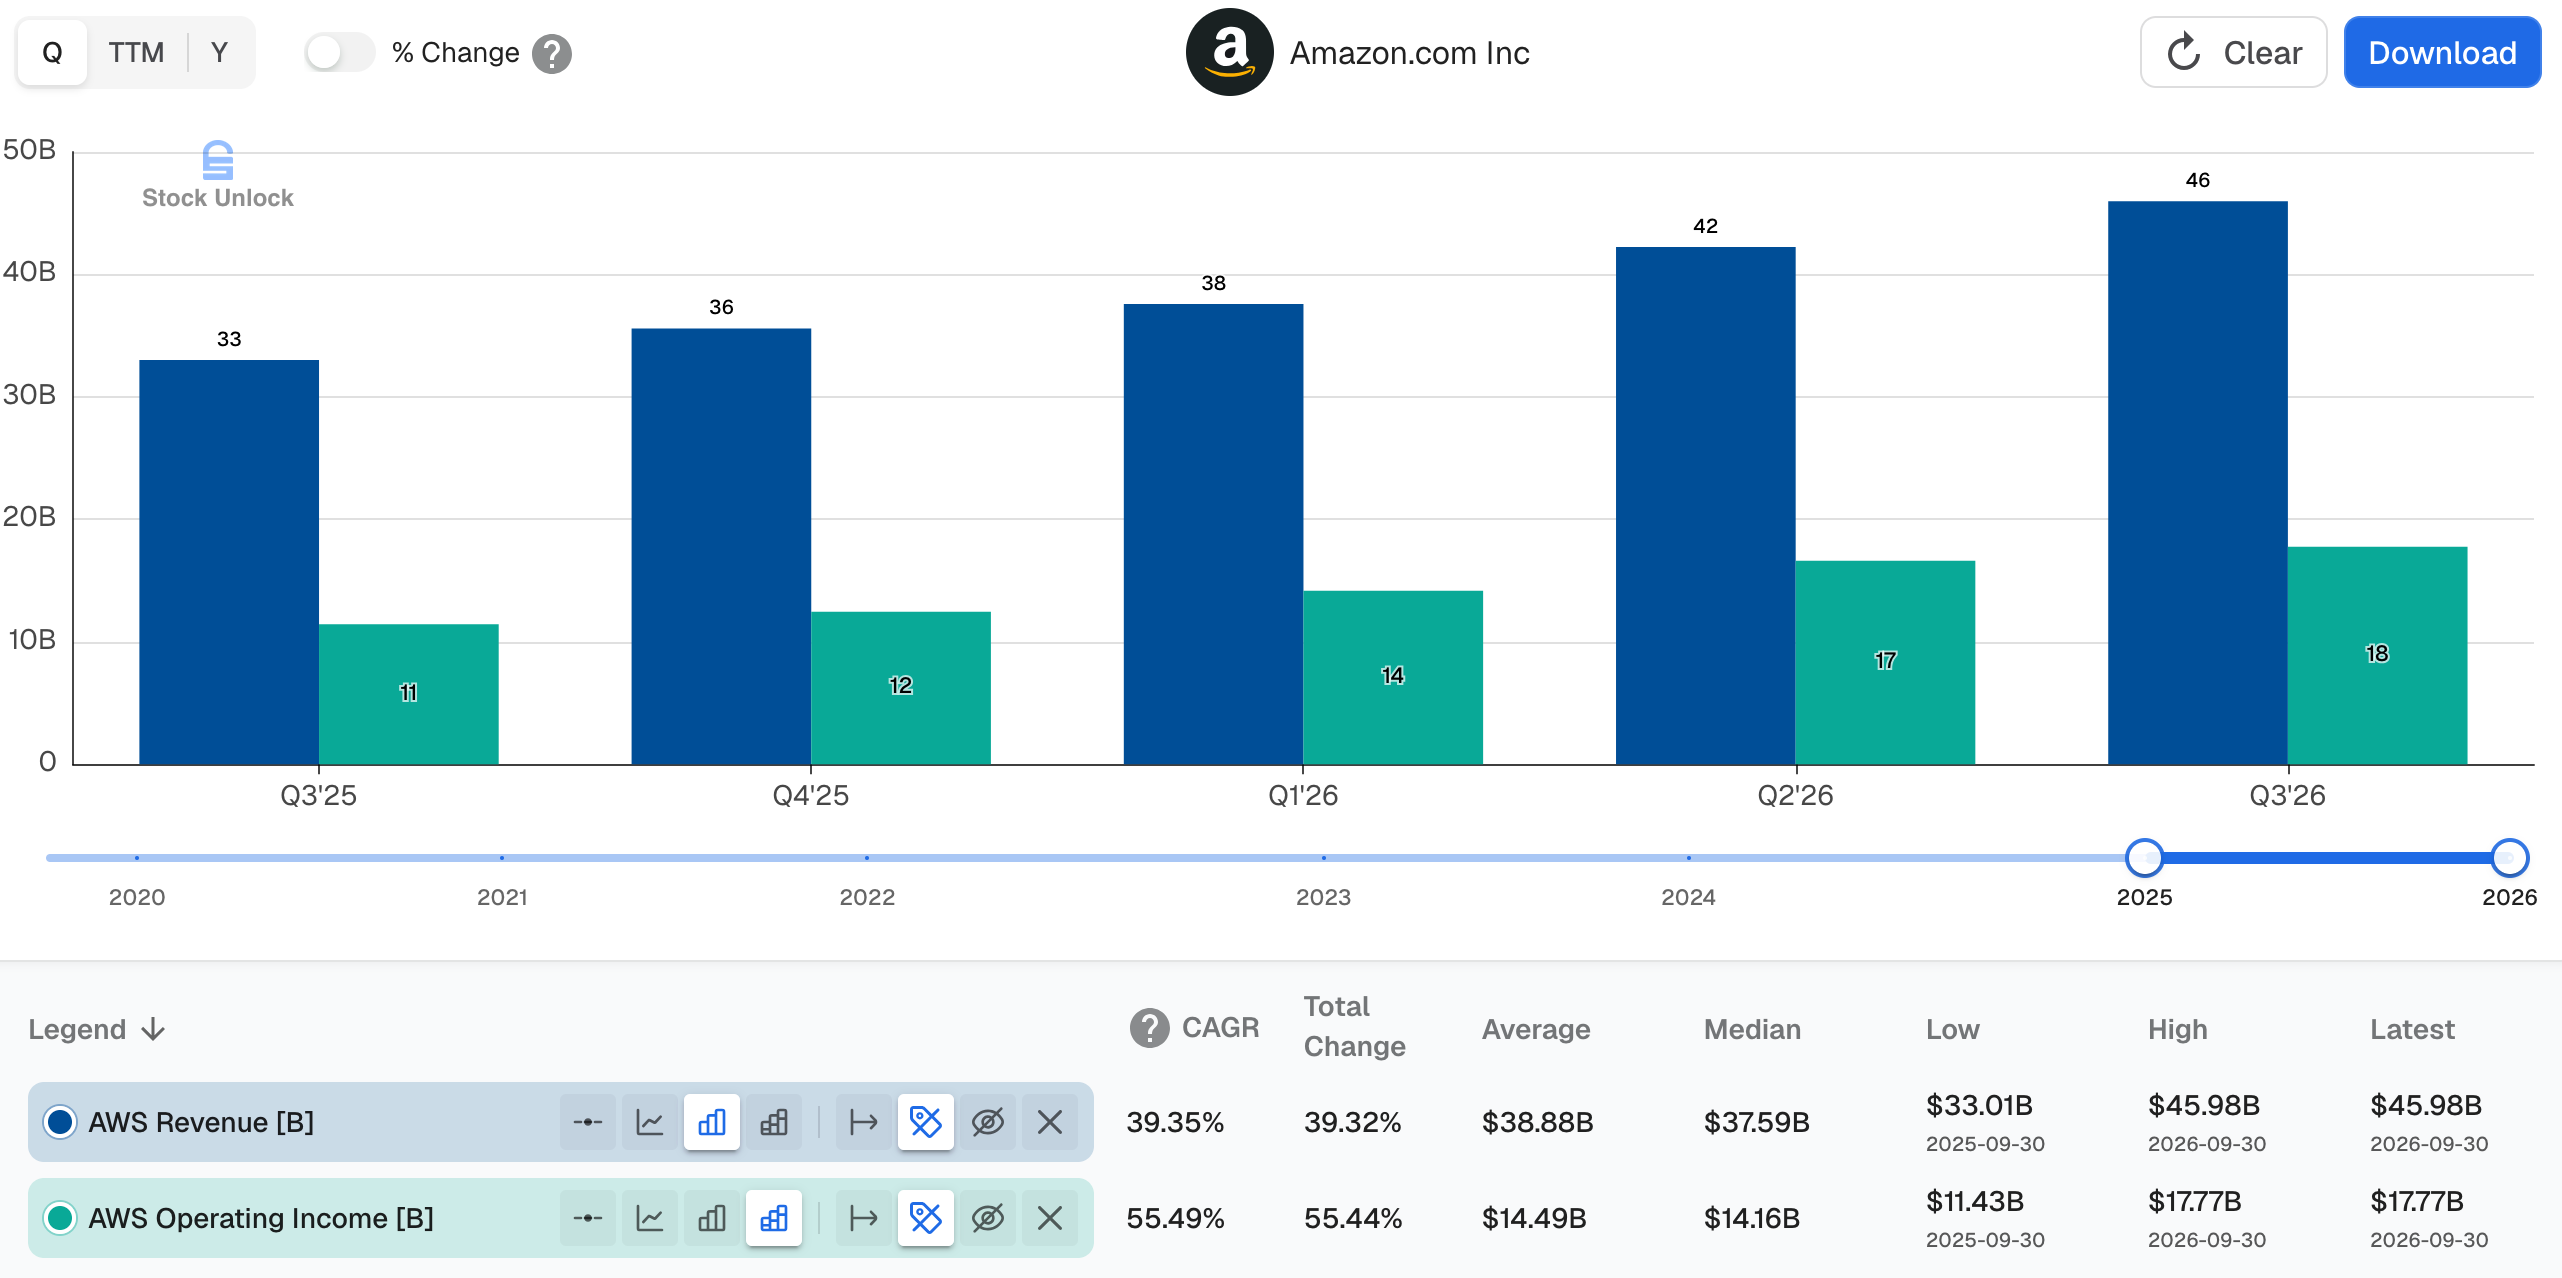
AWS growth accelerated for six straight quarters to 39.3% YoY, its fastest in nearly five years, on $46 billion of quarterly revenue. Jassy noted it came “despite lapping a comparable year-over-year period where we added a lot of capacity”.
Operating income rose 55.4% to $17.8 billion, a 38.7% margin, or 38.5% excluding the $91 million gain on energy contracts, against 34.6% a year ago. The margin widened even as AWS depreciation rose from 17.1% to 20.1% of revenue. All other AWS costs fell from 48.2% to 41.3% of revenue, so growth absorbed the higher depreciation and widened the margin by 4 points. Jassy said margins are “rapidly improving on the AI side too, well ahead of where they were on core at a similar time of evolution”. He said that holds “even with heightened component costs like memory and significant depreciation from the CapEx we’re investing”. He gave no figure for AI margins. Sequentially, the margin slipped from 39.4% in Q2. AWS earned 63% of Amazon’s Q3 operating income on 23% of its revenue, which is what lifted the consolidated margin to a record 13.9%.
AWS added $3.8 billion of revenue from Q2 to Q3, against $4.6 billion from Q1 to Q2. That gap has a mechanical explanation. Revenue follows capacity, and capacity arrives unevenly. Asked about it on the call, Jassy said Amazon plans capacity eight to ten quarters out, and that the amount it brings online differs from one quarter to the next. Demand isn’t the constraint. He said customers take capacity “almost as fast as we install” it, and that core compute and storage revenue grew at its fastest pace in years.
AWS grows on more than AI hosting. Inference already makes up “well over half of AWS’s AI revenue”, according to Jassy. Fortune 500 companies spent nearly 7x more YoY on Bedrock, AWS’s inference service, and Bedrock token volume grew nearly 17x. Jassy argued that AI work pulls core services along with it. Post-training, reinforcement learning and tool use run mostly on CPUs rather than accelerators, and customers want inference near their data. Graviton and Trainium revenue commitments each rose more than 20x YoY, and customers using Amazon’s chips saved over $2 billion in Q3. Amazon plans to sell Trainium outside AWS from late 2027, and Jassy described the trade-off: A chip sold externally books its revenue immediately. The same chip run inside AWS earns revenue and cash for five to six years.
Jassy’s view of the model layer explains why AWS doesn’t need to pick a winner among the AI labs:
“I’ll say in the next two to three years, I think there are going to be 6-8 models that are about as good as each other, or at least good enough for 95%+ of the workloads.”
Bedrock already carries closed models from Anthropic and OpenAI next to open models such as Kimi and GLM, and Jassy said it “could be a service as large as EC2”. That’s the aggregator position I described in Undervalued by Design.

When models become interchangeable, the value goes to whoever owns the customer relationship, the data and the security controls. If models converge, the labs compete on price per token, and AWS earns on the compute, storage and security around every interaction, whichever model serves it.
The cloud migration underneath all of it is far from finished. Jassy restated the figure he uses for the size of that runway:
“[...] it’s important to remember that the vast majority of global IT spend, about 85%, is still on premises, and we’re in a 10- to 20-year cycle where that equation will flip to the cloud.”
What 40% in 2027 and 2028 adds up to
Through September, AWS earned $125.8 billion in 2026. If Q4 adds the same $3.8 billion as Q3, full-year AWS revenue lands near $175.5 billion. Growing 40% a year from there gives about $245.8 billion in 2027 and $344.1 billion in 2028.
From $344.1 billion, $1 trillion of annual revenue by 2031 requires 42.7% a year for three more years. By 2036, it requires 14.3% a year for eight. For a business that just accelerated for six quarters at a $184 billion run rate, the ten-year timeline is plausible. The five-year timeline requires holding 40% to the end of the period.
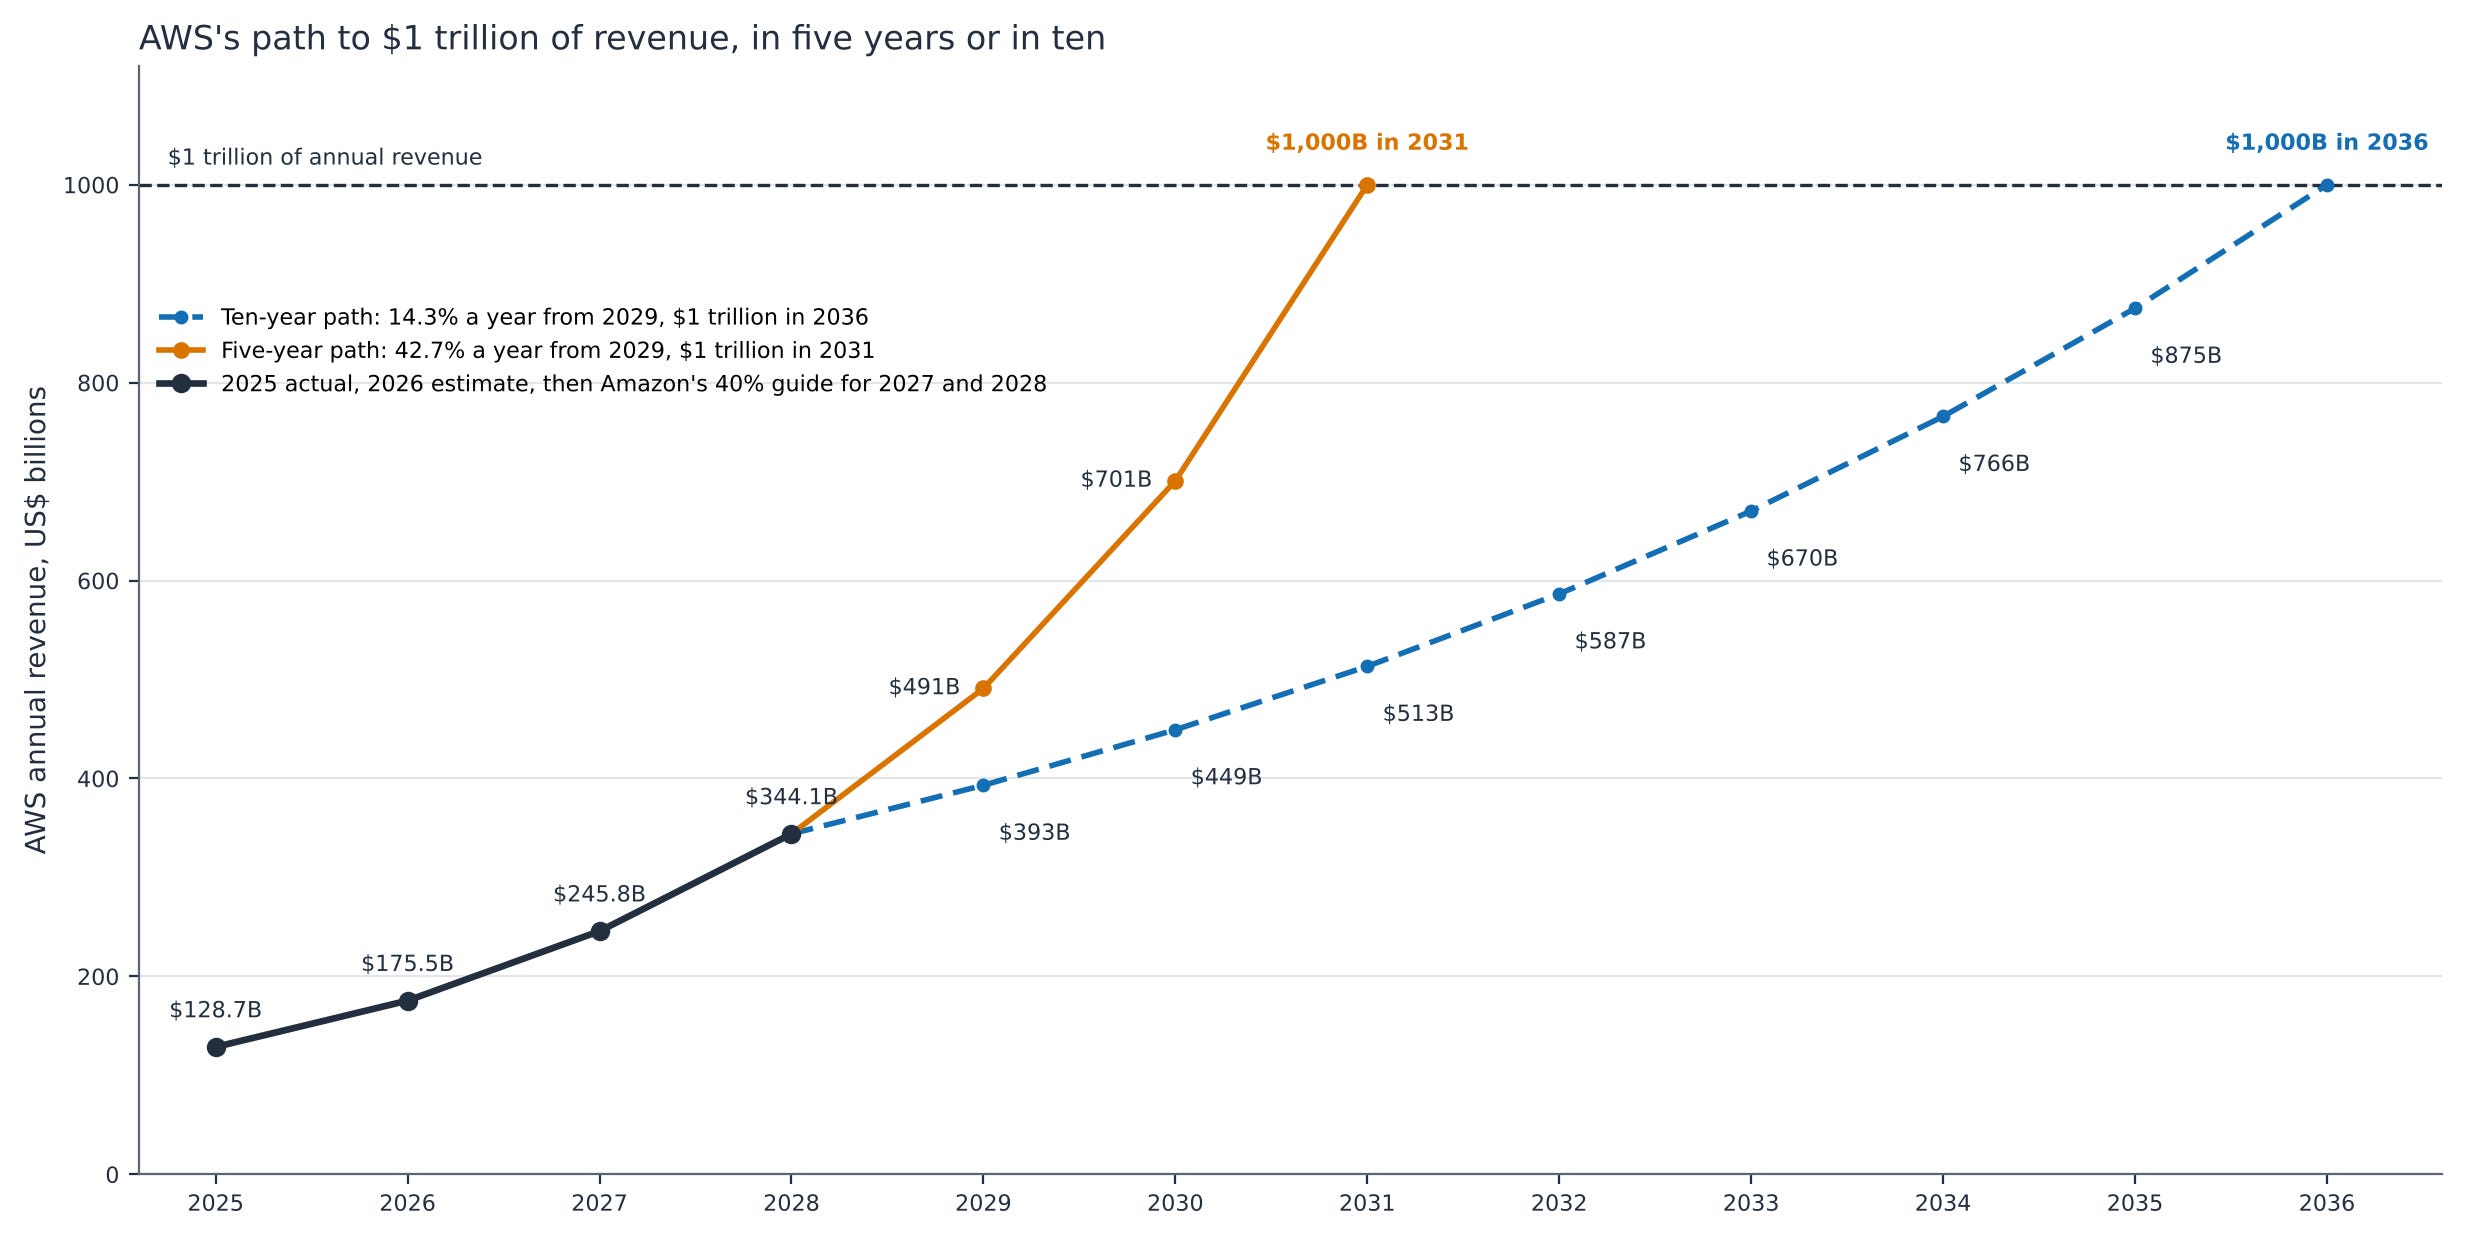
I treat the trillion dollars of revenue as a measure of the opportunity, not as an input. My valuation below doesn’t use it.
Stores are closer to a trillion of revenue, and earn far less
The trillion dollars of revenue is close. Growing 10.7% a year, the $636.1 billion of TTM stores revenue passes $1 trillion of annual revenue in 4.5 years.
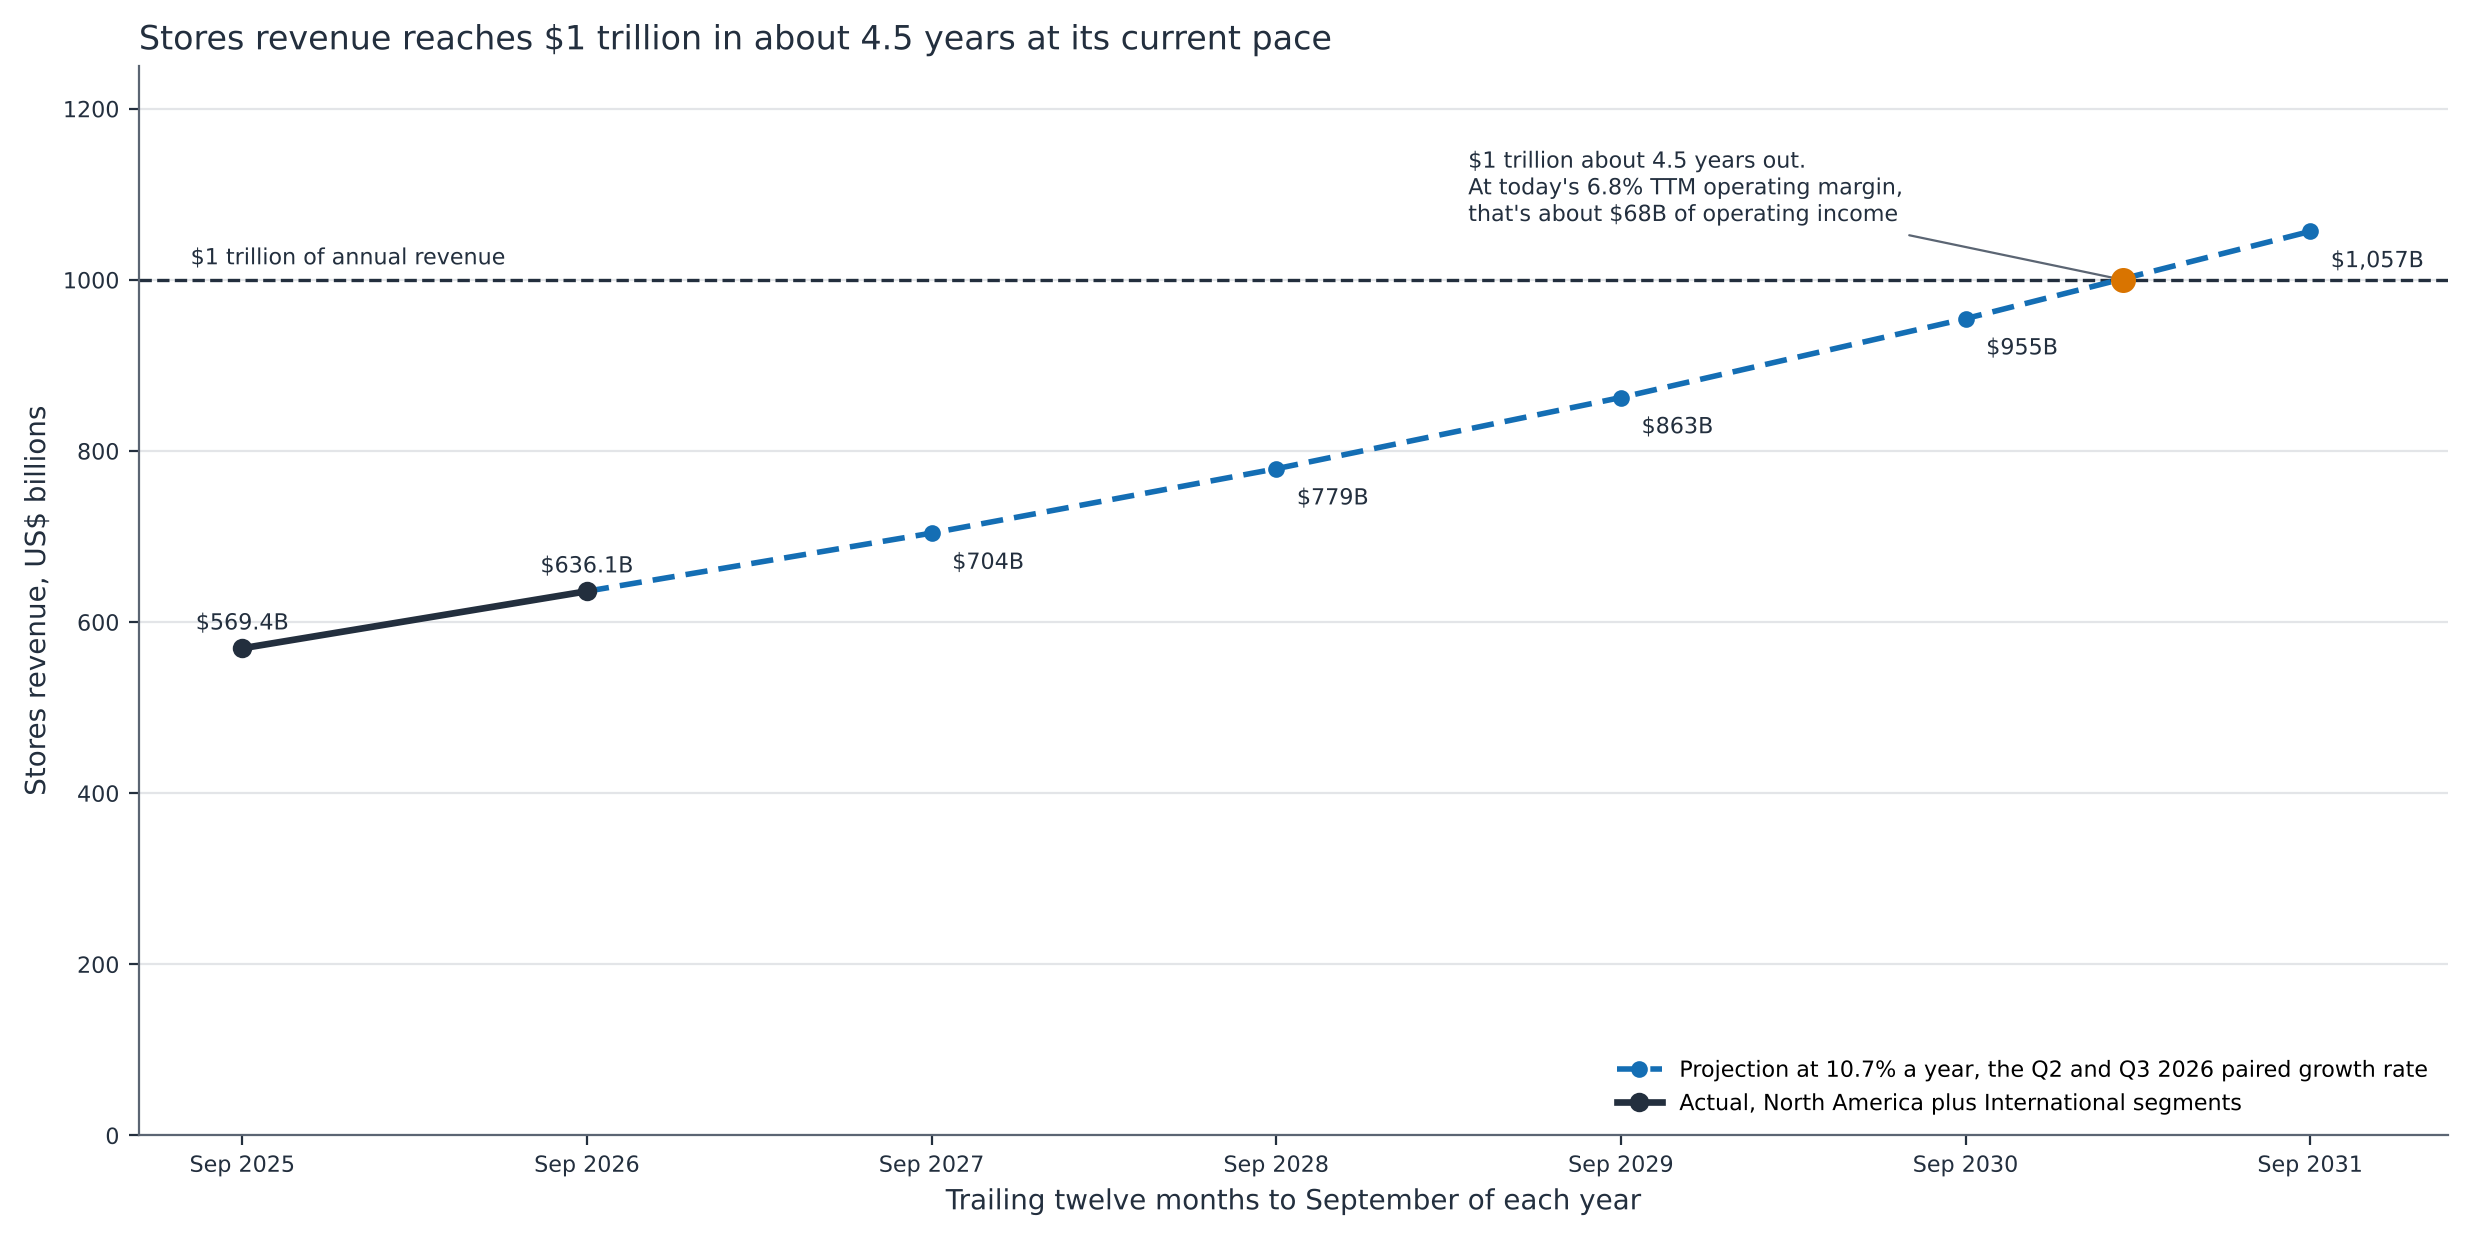
On profit margin, Jassy argued that investors underrate the retail business:
“I’m not aware of another retail business approaching Amazon’s revenue size, hundreds of billions of dollars, with double-digit operating margins inclusive of ads that’s growing at this pace.”
The segment tables don’t show double digits. TTM operating margin was 8.2% in North America and 3.3% in International, or 6.8% combined. Both segments already include advertising revenue, and the filings don’t reconcile Jassy’s double-digit figure with the reported segments.
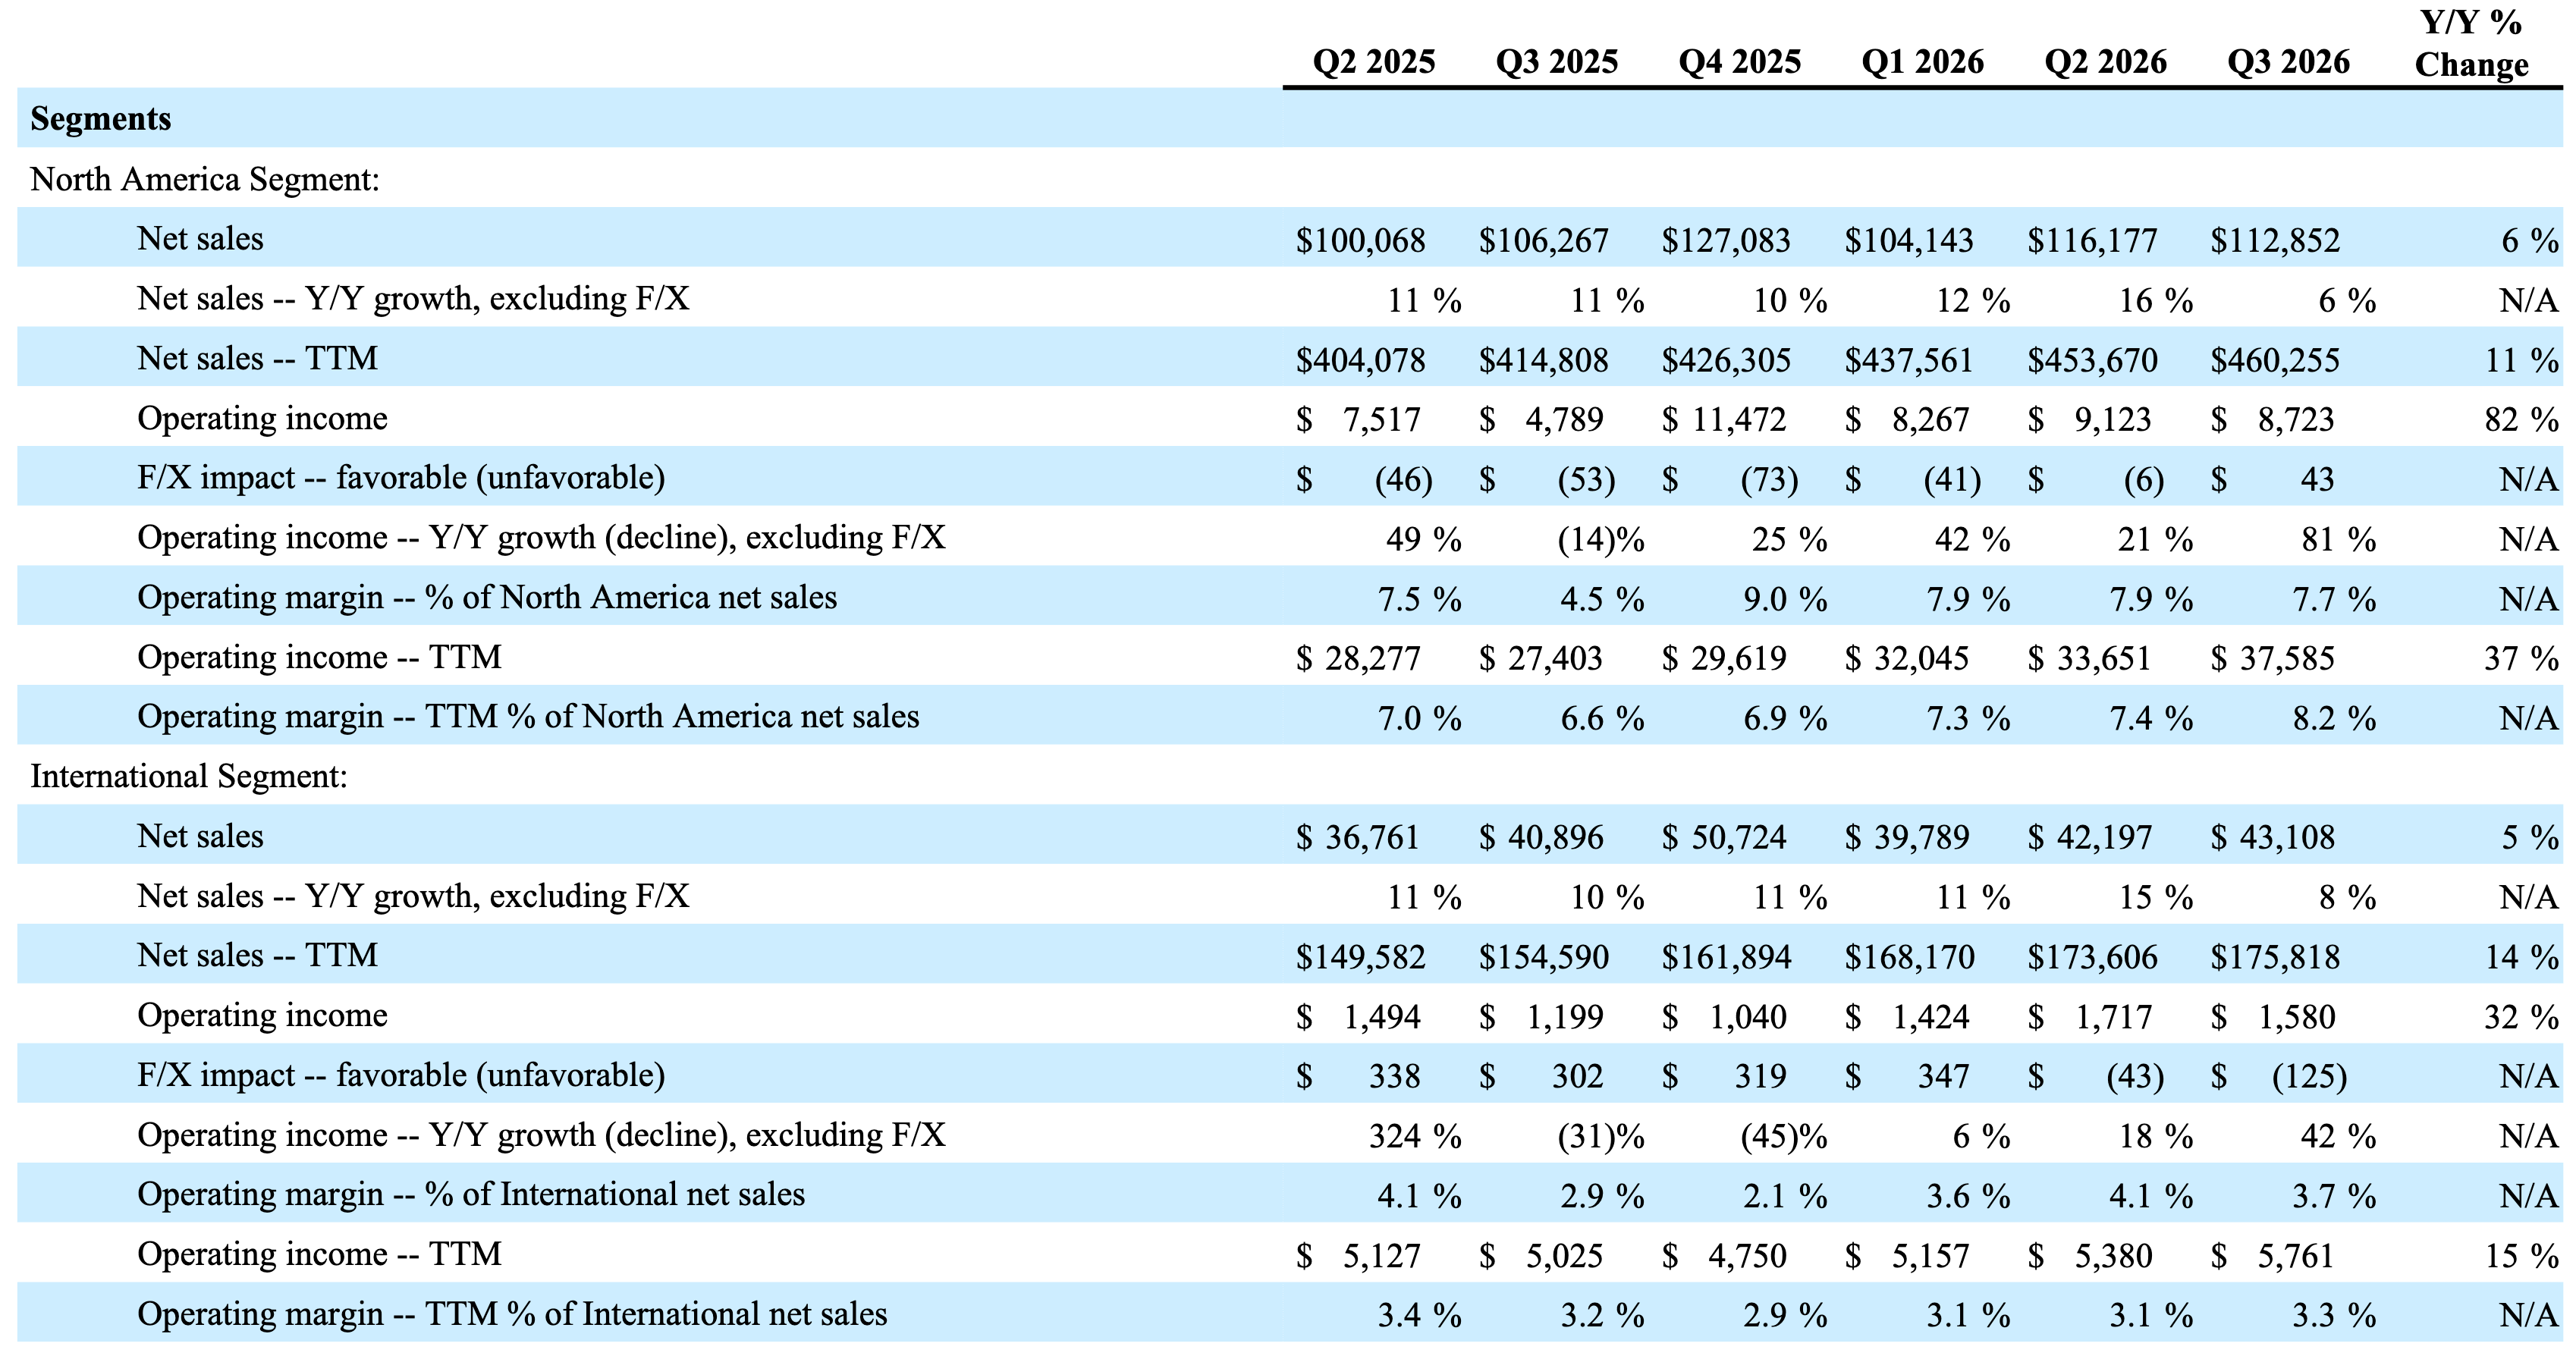
North America’s margin rose from 4.5% to 7.7%, but last year’s Q3 carried the $2.5 billion FTC charge. Adding Q2 and Q3 together, excluding the FTC charge in 2025 and the tariff refunds in 2026, it went from 7.2% to 7.5%. That is a clean 0.3 points of margin expansion.
At today’s margins, $1 trillion of stores revenue earns about $68 billion of operating income. The same $1 trillion of AWS revenue at 38.7% margin would earn $387 billion.
Jassy said units grew nearly 15% year to date, on more than 30 billion items sold last year. Grocery reached nearly $250 billion of gross sales over the TTM. Fresh groceries and everyday essentials grew about 3x faster than the rest of the store, and they now make up about half of all units. Jassy also said Amazon adds about double the quarterly gross sales of its next-largest US competitor, and Olsavsky said its fleet of robotic arms doubled in 2026.
Cheaper delivery opens categories Amazon couldn’t serve at a profit before. Amazon Now, its ultra-fast delivery service, runs in over 450 towns and cities, with items ordered up 10x YoY. Amazon Pharmacy customers grew over 60% YoY, with growth accelerating each quarter of 2026, and three-hour prescription delivery reaches more than 350 cities. Customers repeat these purchases weekly or monthly. This habit is Amazon’s answer to the agentic shopping risk I discuss below. An outside agent can compare prices, but it can’t deliver a prescription in three hours.
Prime Day moved the comparison
Prime Day fell in Q3 in 2025 and mostly in Q2 in 2026, which depresses every retail line in this quarter’s comparison. Pairing Q2 with Q3 in both years removes the shift.
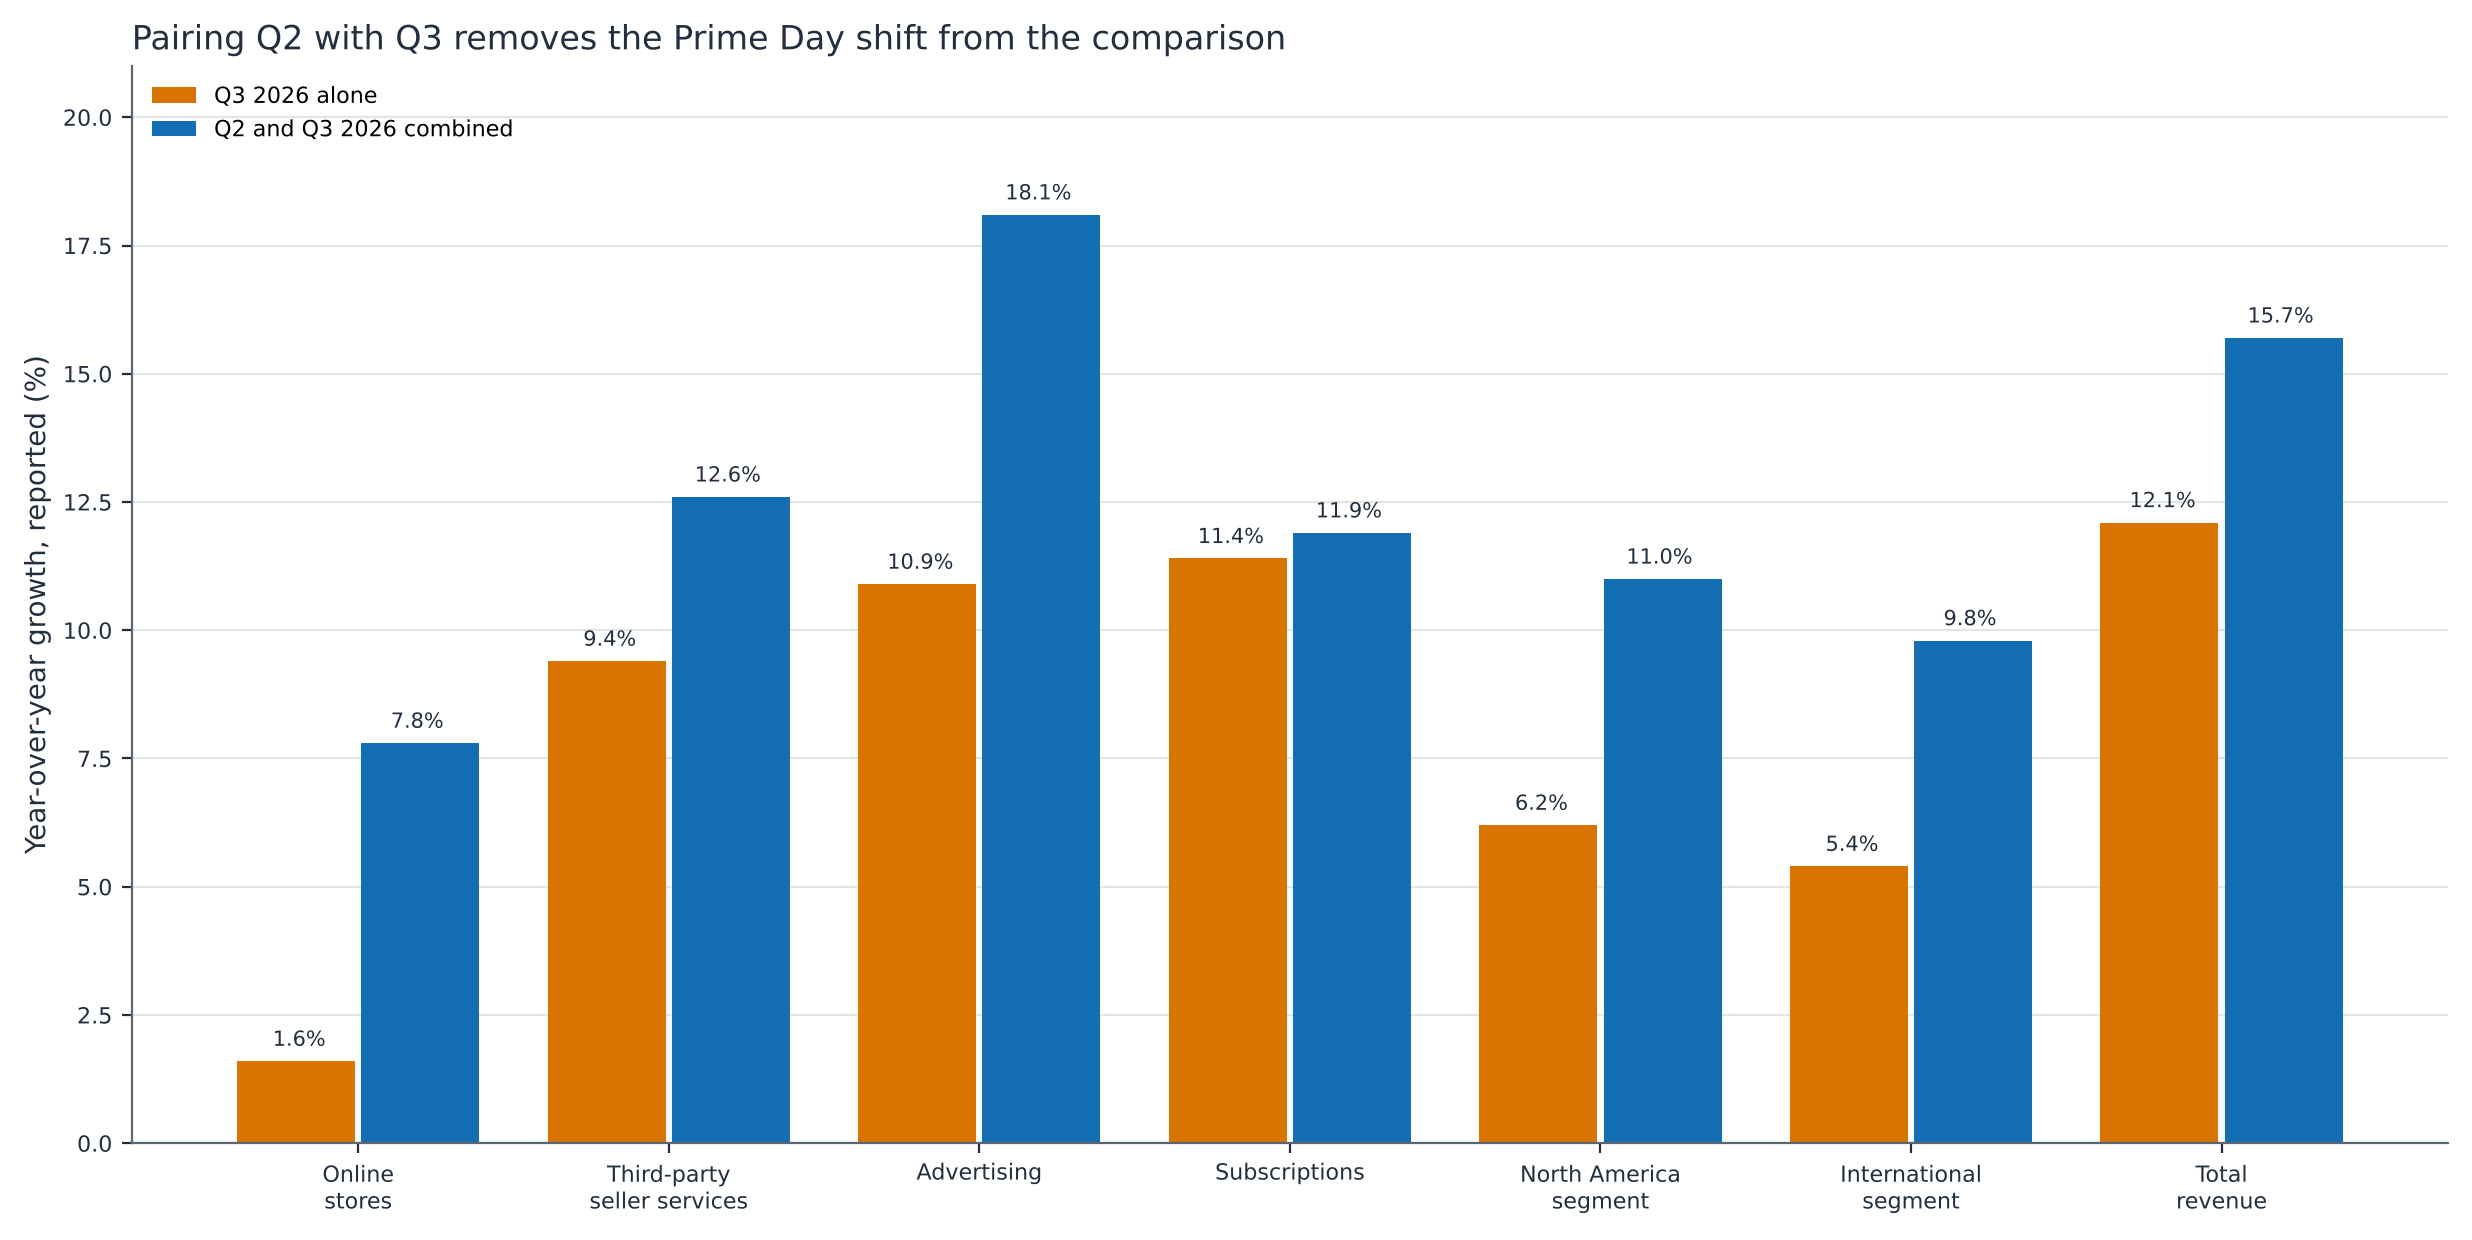
Adding Q2 and Q3 together cancels the Prime Day shift. On that basis, North America and International grew 10.7% combined, from $284 billion to $314.3 billion, which is the rate behind the 4.5 years to $1 trillion of revenue. On the same basis, total revenue grew 15.7%, from $347.9 billion to $402.6 billion.
Advertising slowed beyond the timing
Jassy listed three effects on the advertising rate:
“First, we shifted Prime Day into Q2 for most countries, moving significant sales and ad revenue that were in Q3 2025 into Q2 2026, a tailwind to our Q2 2026 rate and a headwind to Q3 2026. For advertising, that was 850 basis points sequential impact to Q3 year-over-year growth. Second, Q2 2026 included the first season of NBA on Prime, which last year’s Q2 didn’t have. Q3 does not include any NBA, it starts in Q4. Third, in Q3 2025, we changed our search engine marketing programs to drive more traffic to search pages on Amazon.”
Adding 850 basis points to 10.9% YoY growth gives 19.4%, below the 22.9% to 23.9% YoY growth that Amazon reported in each of the four quarters to Q1 2026. The Q2 and Q3 paired figure of 18.1% says the same. Amazon guides Q4 advertising growth to the high teens, in line with the paired rate, for a business line that earned $78 billion over the TTM.
The bear case is shopping agents bypassing Amazon’s search results and the ads in them. Jassy answered it in his prepared remarks:
“The natural question is whether agentic shopping from external horizontal agents is meaningfully impacting Amazon Ads. The answer is no.”
He added that agentic shopping remains rare, because buying through an outside agent isn’t yet more convenient than buying on Amazon directly. Amazon’s own agent, Alexa for Shopping, reached over 400 million users in 12 months, and US users spend 50% more per order. If advertising doesn’t return to the high teens in Q4, without the Prime Day timing noise, the deceleration is structural.
The shipping spread turned back
In Q2, shipping costs outgrew paid units for the first time in 15 quarters, and I made the spread a signpost. Q3 reversed it, despite higher fuel and line-haul costs.
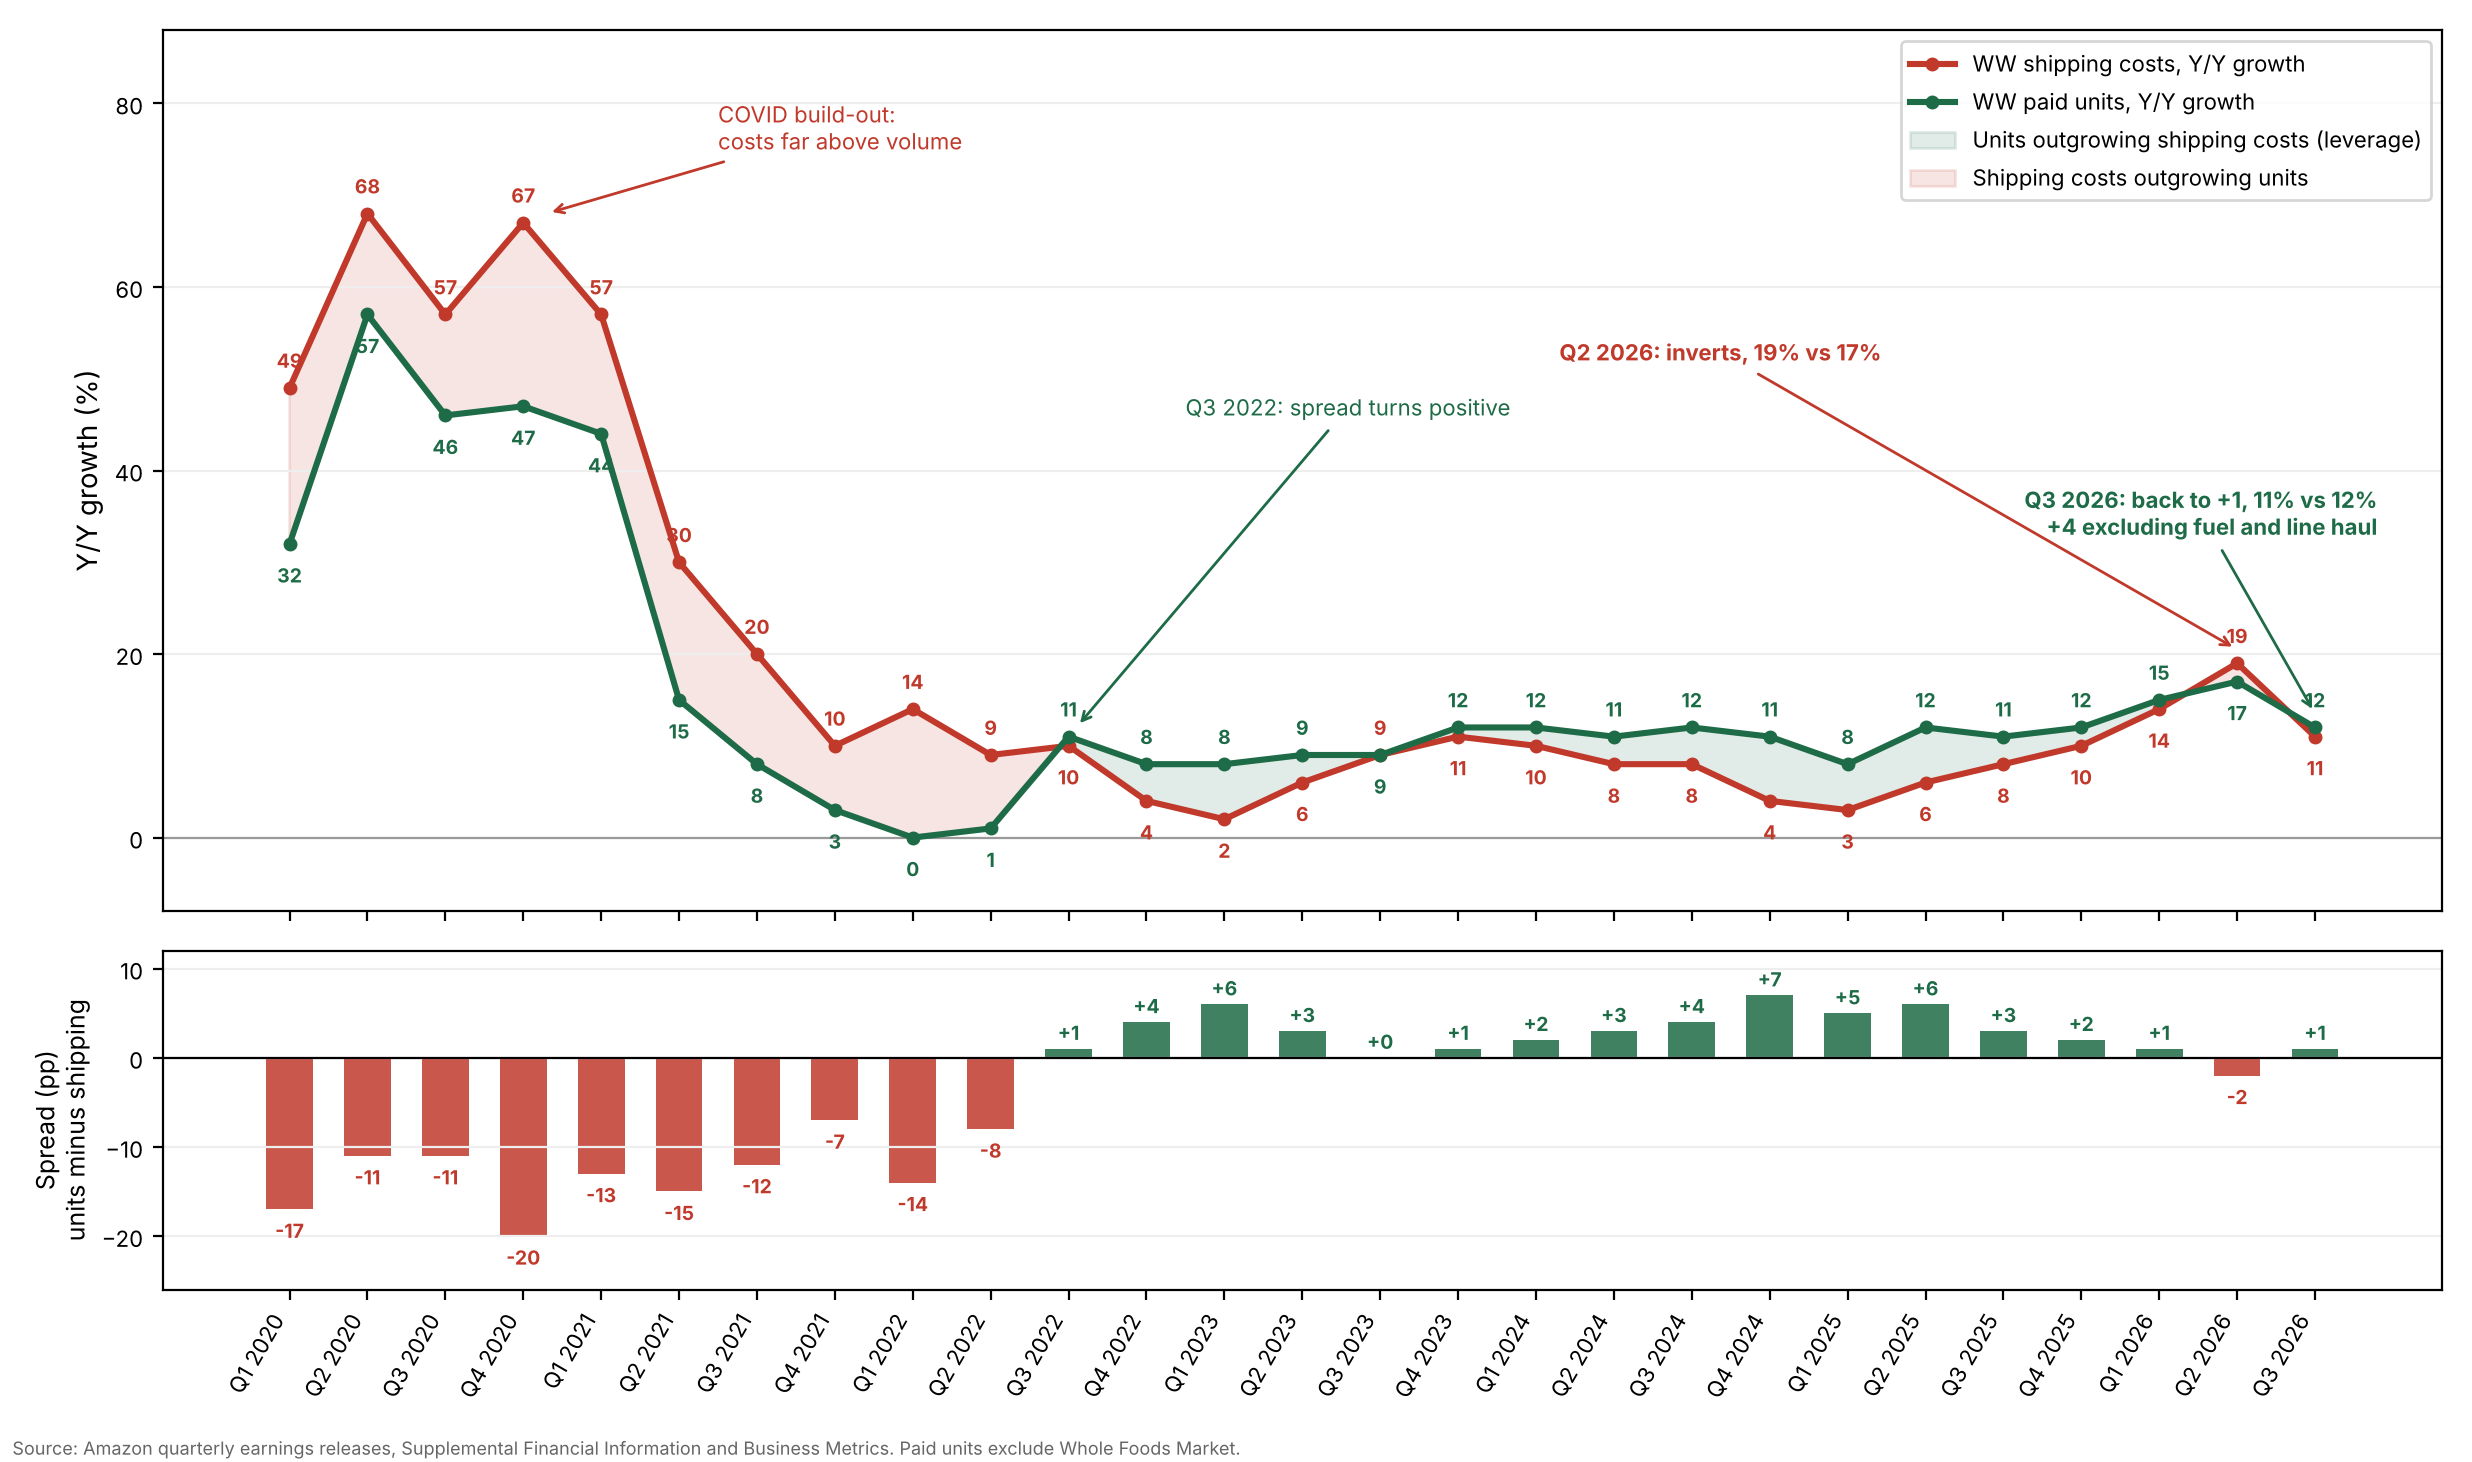
Paid units grew 12% and shipping costs 11%. Olsavsky said fuel inflation and higher line-haul rates raised transportation costs in the quarter, and that shipping costs grew 8% without them. The fuel surcharge Amazon introduced for Fulfillment by Amazon sellers this year recovers part of that cost. Olsavsky credited “better inventory placement, shorter shipping distances, and package consolidation”, and Jassy said Amazon is on track to cut cost to serve per unit for a fourth consecutive year. The spread still narrowed from +7 points in Q4 2024 to +1 in Q3 2026.
Negative free cash flow buys AWS capacity
Q3 OCF grew 19.4% to $42.4 billion, below the 28.8% TTM rate. Amazon spent $75.9 billion of cash CapEx in Q3 against that $42.4 billion of OCF, which leaves FCF of -$33.5 billion in a single quarter. Over the TTM, cash CapEx rose $94.8 billion to $210.7 billion.
The 10-Q doesn’t split cash CapEx by segment. Its segment note discloses net additions to property and equipment instead, the measure I used to size the AWS share in what the $220 billion CapEx plan returns. The two measure different things. Cash CapEx counts what Amazon paid in the period. Net additions count what it received, including equipment not yet paid for and assets under finance leases. Through September, net additions were $196.9 billion against $172.2 billion of cash CapEx. Of that $196.9 billion of net additions, AWS received $147.2 billion, or 74.8%. AWS net property and equipment rose $123 billion, from $190.1 billion to $313 billion. Through September, net additions ran $24.7 billion ahead of the cash. The unpaid balance for property and equipment rose $21.5 billion in nine months, and accounts payable went from $121.9 billion to $158.7 billion. Part of the 2026 build gets paid for in 2027.

The 10-Q says cash CapEx will “meaningfully increase in 2027”. Jassy explained why Amazon won’t pace it:
“Would it be more convenient if this type of acceleration and opportunity happened over 25 years and you could spread the CapEx over 25 years? Yeah, it might be more convenient, but that’s not the world that we live in, and that’s not the opportunity. We can fund this plan.”
Amazon has run this sequence before. In the Q2 2026 results article, I showed the last AWS build cycle: CapEx ran ahead of demand, FCF went negative, then it inflected to $48.3 billion. Spending that far ahead is the right call only if the returns hold.

Debt keeps funding part of the build
Long-term debt rose from $65.6 billion at the end of 2025 to $173.1 billion at the end of September, as Amazon borrowed $115.1 billion in nine months. In the same quarter it borrowed $48.1 billion, it also paid $21.3 billion into OpenAI. The debt isn’t a solvency problem for a company with $168.3 billion of OCF, but borrowing $100 billion or more every year isn’t sustainable either. I’ll cover the balance sheet, and what the debt line leaves out, in a separate article.
Valuation: operating cash flow is the anchor
I value Amazon on operating cash flow per share, as I set out in my Q4 2024 article. In a CapEx cycle this large, FCF measures the construction schedule rather than earning power.
TTM OCF grew 28.8% to $168.3 billion, 21.1% of revenue and above the 20.8% I called a record in Q2. On 11.03 billion shares, that’s $15.25 per share. At $267, that’s 17.5x TTM OCF, against a 10-year median of 24.7x.
The five-year sketch:
Grow TTM OCF of $168.3 billion at 20% annually for 5 years, to $418.8 billion. That’s below the 28.8% TTM growth rate.
Dilute at 0.72% a year, the rate of the last twelve months, from about 11.03 billion shares to 11.44 billion. Year-five OCF per share is about $36.62.
Apply a 20x exit multiple, below the 24.7x 10-year median. The implied year-five price is about $732.
Discount at my 10% hurdle. Fair value is $455 per share, and the $267 price sits 41.3% below it. That’s an implied 22.4% annual return over five years.
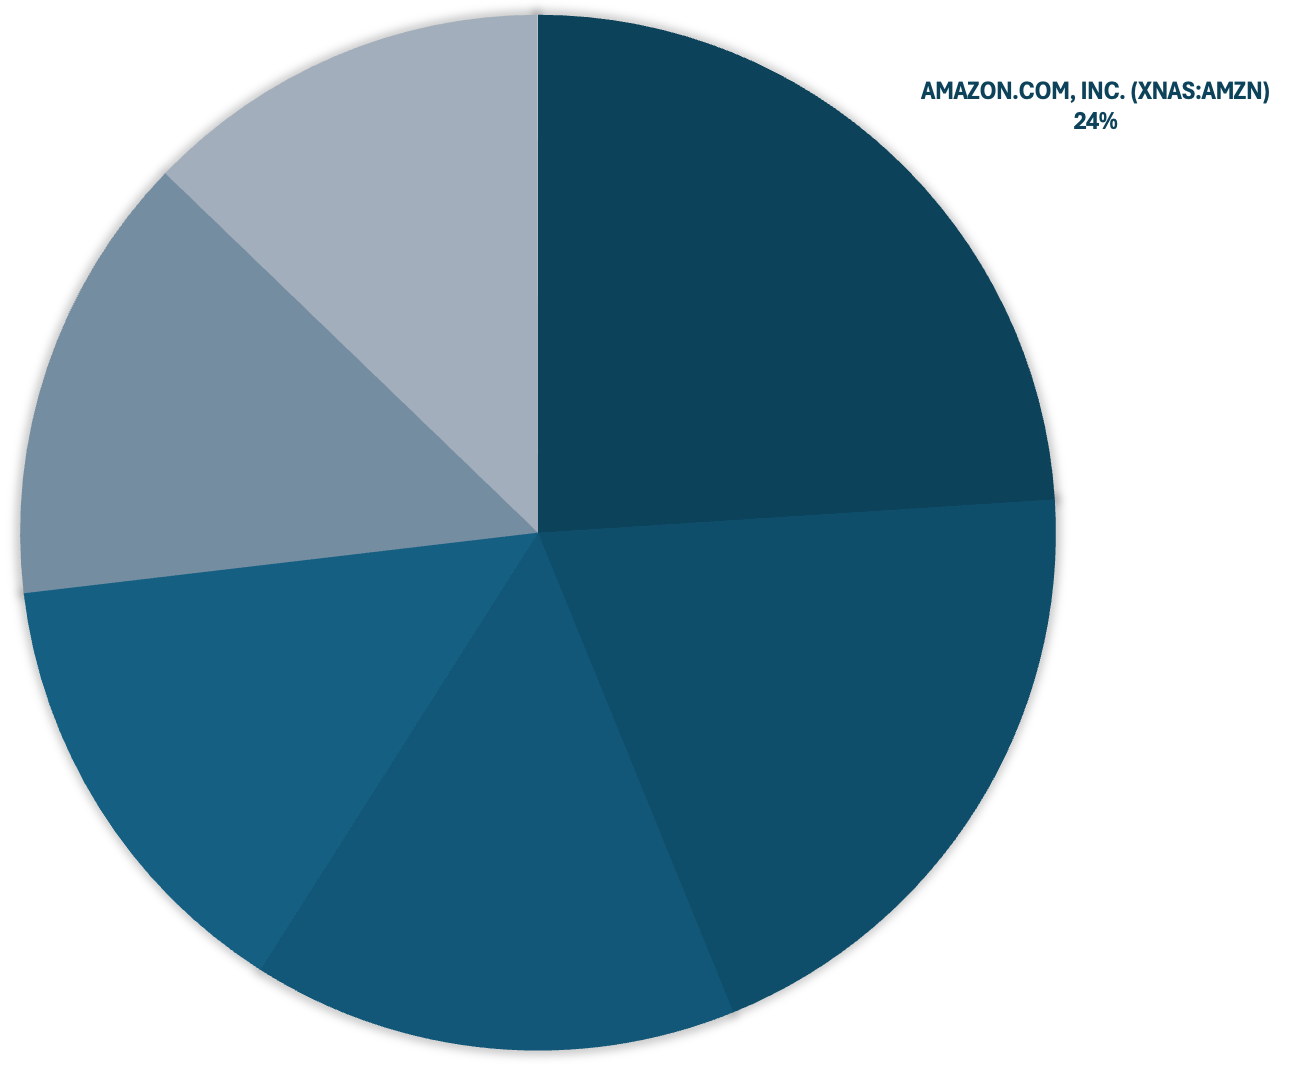
A 41% discount would normally have me buying. I am not adding, because Amazon is already 24% of my portfolio as of early November, the size I want it to be. I’m holding.
Final thoughts
AWS accelerated growth for a sixth quarter at a 38.5% clean margin, and Amazon now gives growth guidance two years out. Setting Prime Day aside, stores grew 10.7%, and the shipping spread turned back. Jassy’s two trillions aren’t equal: The stores trillion is a revenue milestone. The AWS trillion is the one that justifies $210.7 billion of TTM CapEx and a balance sheet that now carries $173.1 billion of debt.
The risk I’m monitoring is AWS capital intensity: segment assets grew 66% in nine months against 34% for operating profit, and Amazon borrowed to fund the difference. If the 2026 data center shells bill on schedule, the return recovers. If they don’t, Amazon will have borrowed for growth that never arrived.
Three of the four Q2 signposts pointed my way this quarter, and the fourth gave a mixed reading. The one that turned against me in Q2 turned back:
TTM OCF growth above 20%: it was 28.8%, down from 33.2% quarter on quarter (QoQ).
AWS clean operating margin in the mid-30s: it was 38.5%, up from 38.2%.
Backlog composition: the Q3 increment of $82 billion carried no new sized commitment from an AI lab. One unsized OpenAI agreement remains.
The shipping spread: it went from -2 points to +1.
The same four signposts carry forward, each with the threshold that would change my mind:
TTM OCF growth: Q3 alone grew 19.4%, an early warning. If TTM growth falls below 20%, the rate my valuation assumes, I’ll lower that assumption, and my fair value with it.
AWS clean operating margin in the mid-30s: it’s 38.5%, with AWS depreciation up 63.4% YoY. A clean margin below 35% would mean depreciation is growing faster than revenue can absorb.
Backlog composition: two AI labs hold 42.9% of the $578 billion. If their share passes half, the backlog is growing on two customers rather than across the enterprise base.
The shipping spread: it’s back to +1 point. Another negative quarter would make Q2 the start of a trend rather than a one-off.
Jassy said the investment will “forever change the size of Amazon”. Size isn’t the measure I hold him to. The return on the capital is.