

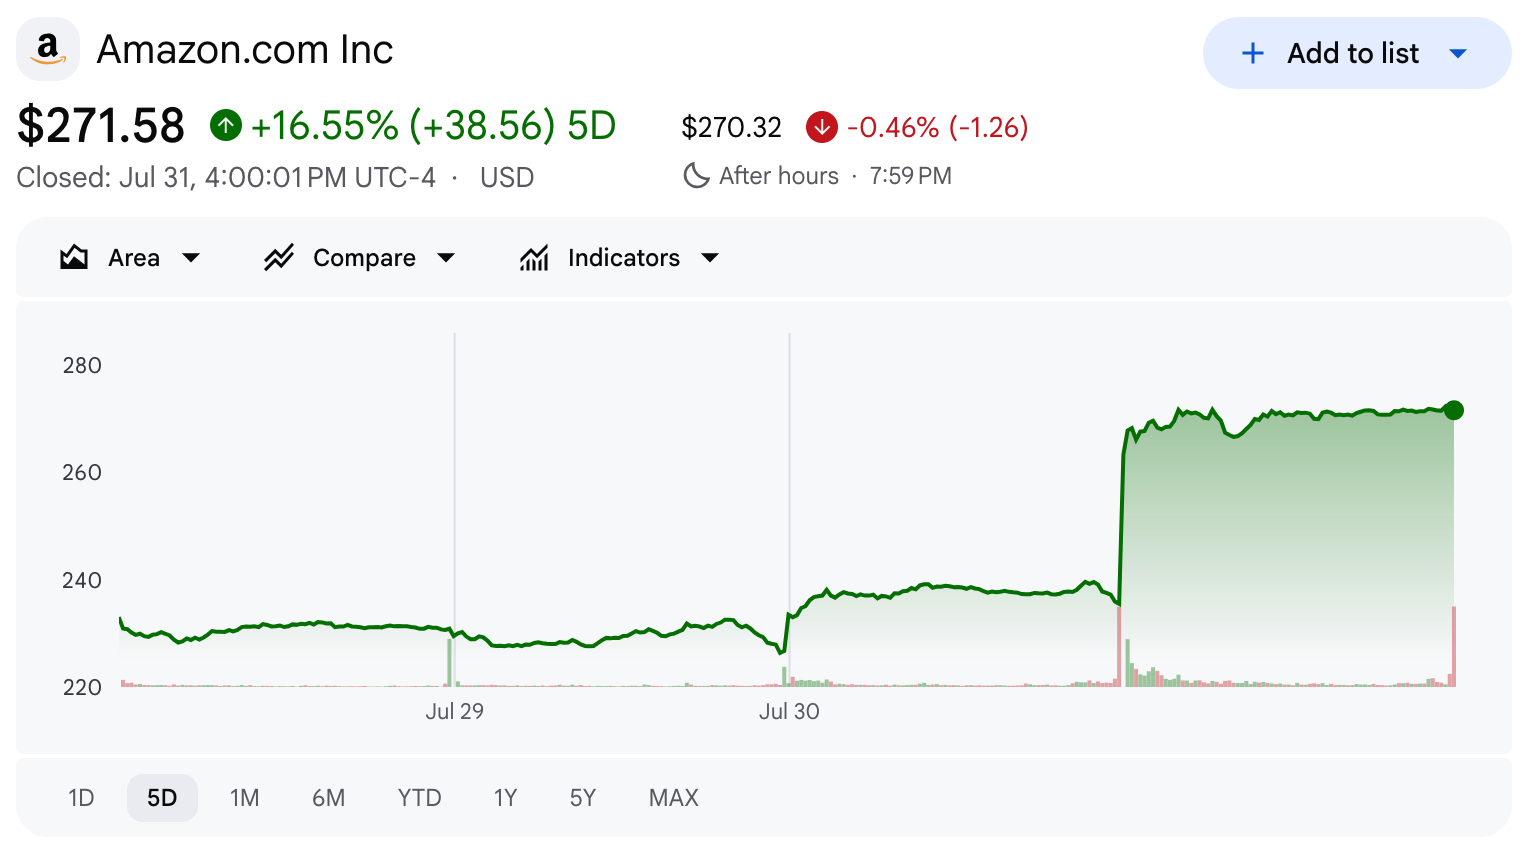
Amazon.com, Inc. (AMZN 0.00%↑) reported Q2 2026 results on July 30. The stock rose 15.3% the next day to $271.58 a share.
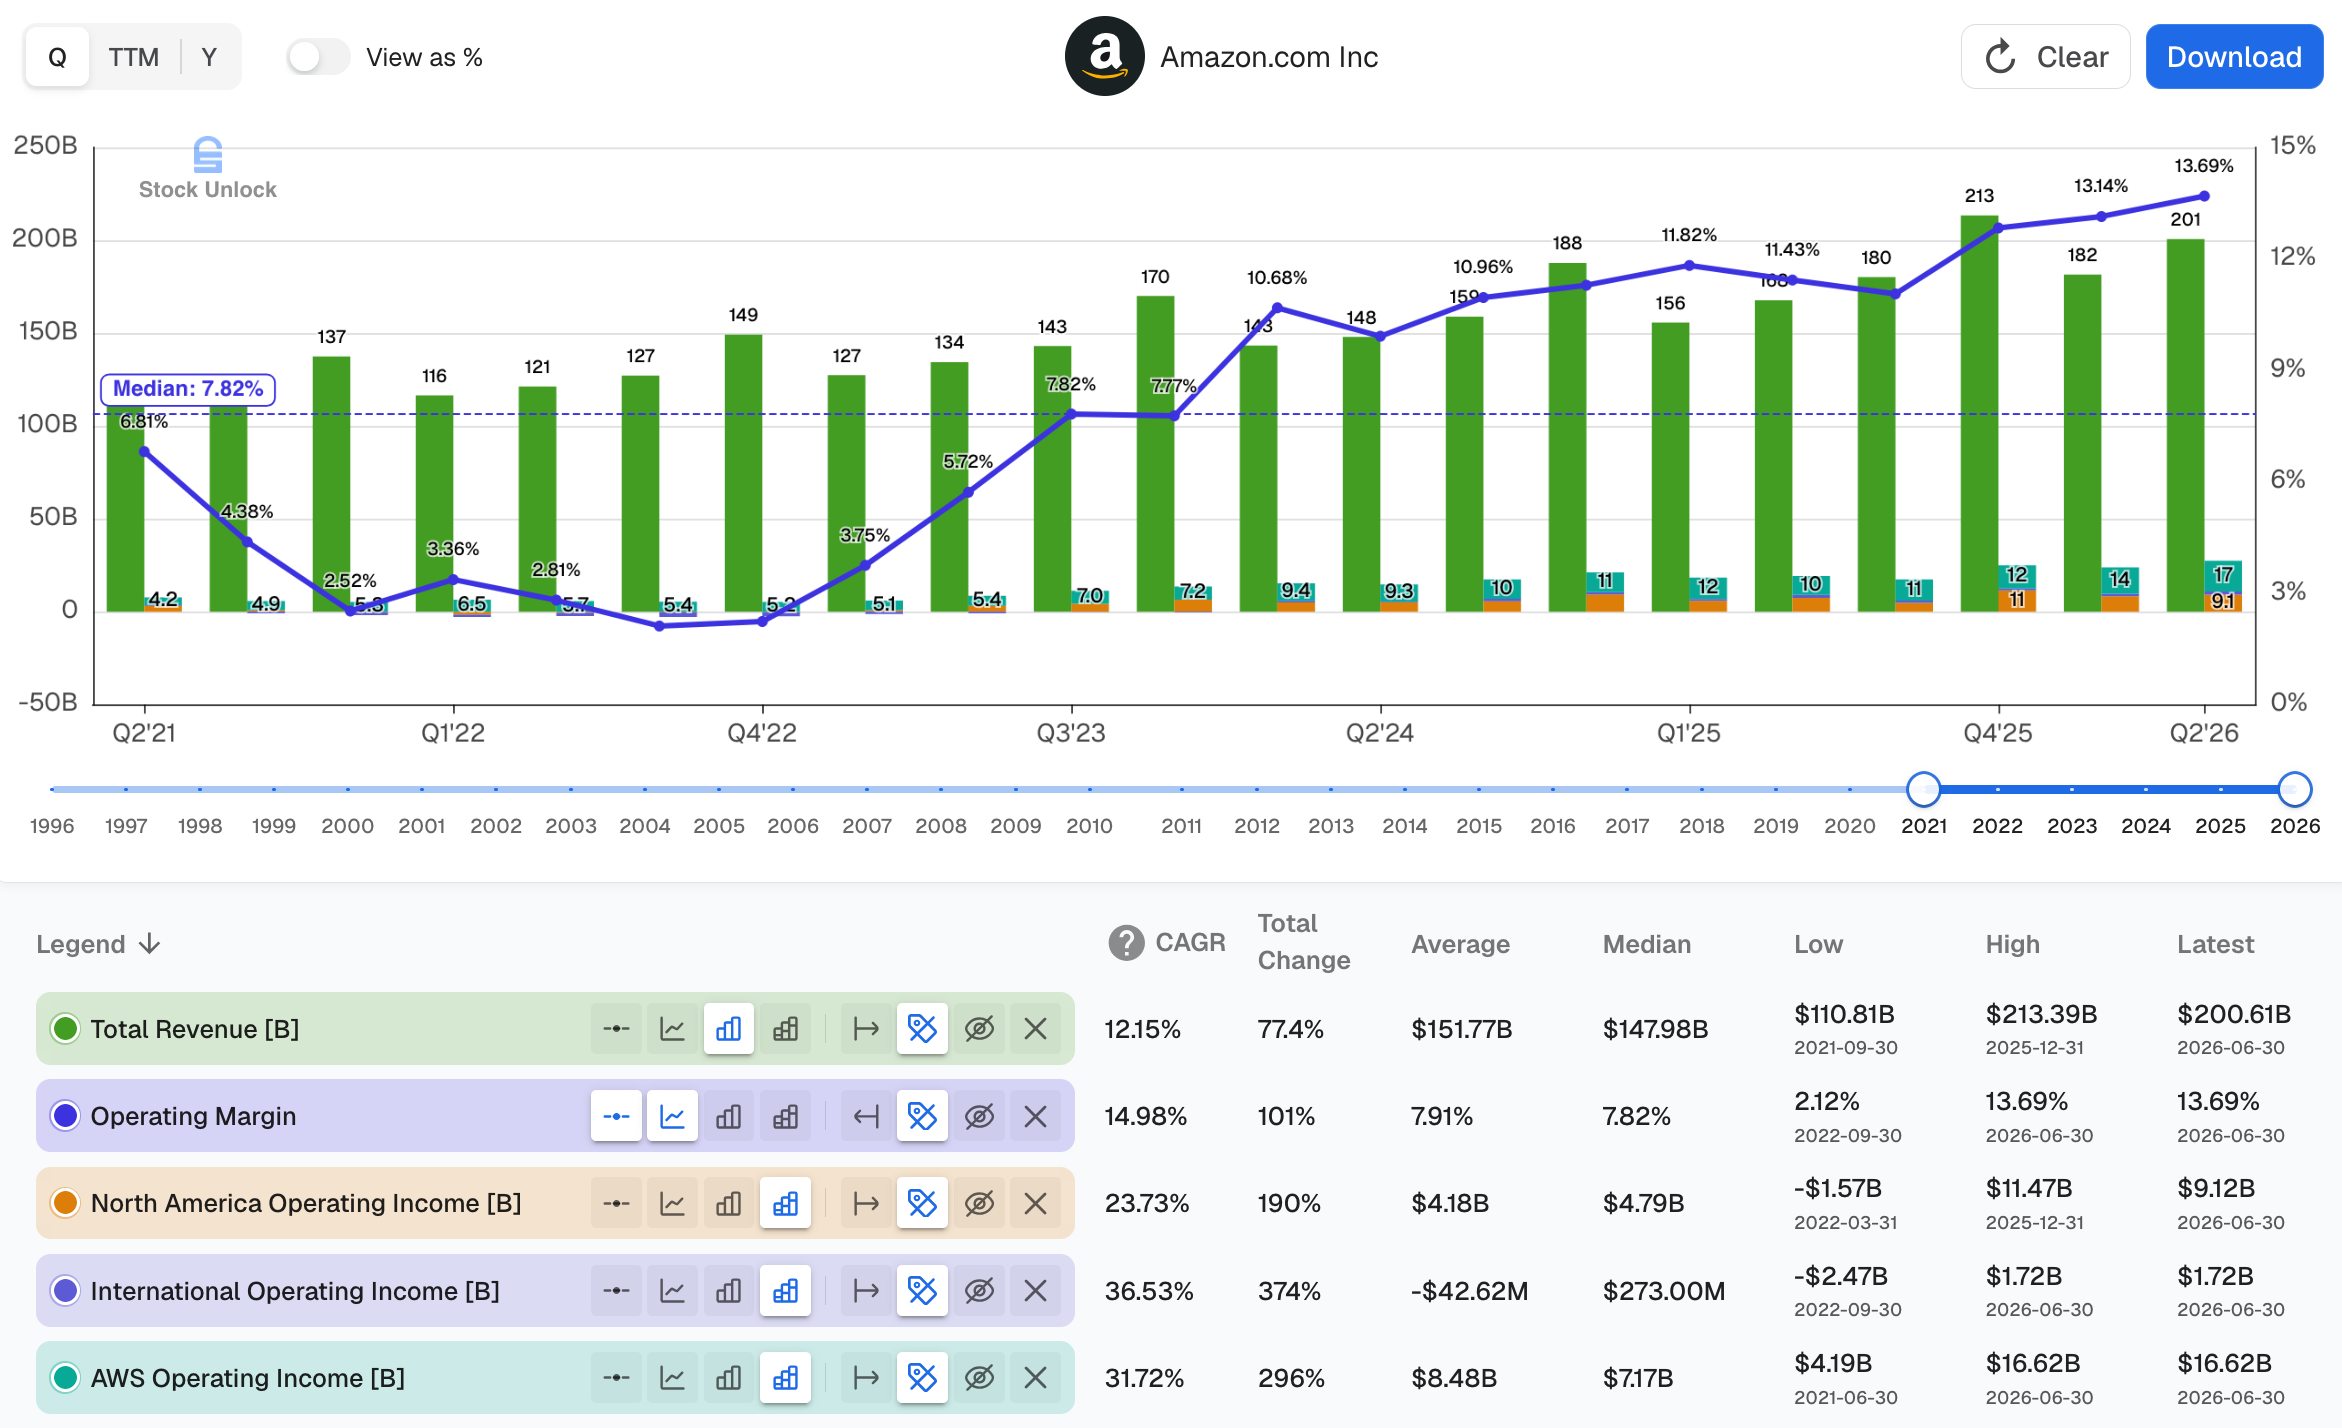
Revenue grew 20% year-on-year (YoY) to $200.6 billion. AWS accelerated for the fifth consecutive quarter to 36.7%, its fastest rate in 18 quarters. Operating income rose 43% to $27.5 billion. Trailing-twelve-month (TTM) free cash flow (FCF) turned negative at an outflow of $7.6 billion, as capital expenditure (CapEx) reached $169 billion. Management then raised the 2026 cash CapEx plan from $200 billion to about $220 billion.
Six months ago, when Amazon first announced the $200 billion plan, the stock fell 11% after hours. This quarter the CapEx plan grew by $20 billion and the stock rose 15.3%. The strategy did not change. The disclosure did. CEO Andy Jassy gave one number Amazon had never published: the payback period on servers.

Q2 2026 highlights
Revenue accelerated to 20%, an $800 billion annualized run rate: worldwide sales of $200.6 billion, up from 15% growth in Q1 2026. Prime Day shifted into Q2 this year. North America grew 16% to $116.2 billion, International 15% to $42.2 billion, and AWS 36.7% to $42.2 billion. TTM revenue reached $775.7 billion. TTM OCF grew 33.2% to a record $161.4 billion at a 20.8% margin, while net CapEx of $169 billion exceeded it.
Operating income grew 43% to $27.5 billion, a record 13.7% margin: the Q1 2026 release guided Q2 operating income to $20-24 billion on sales of $194-199 billion. Two one-off items cut expenses by about $1.2 billion: roughly $600 million of tariff refunds in North America and roughly $600 million from remeasuring energy derivative contracts, mostly in AWS. Excluding both, operating income grew about 37%. TTM operating income reached $93.7 billion at a record 12.1% margin.
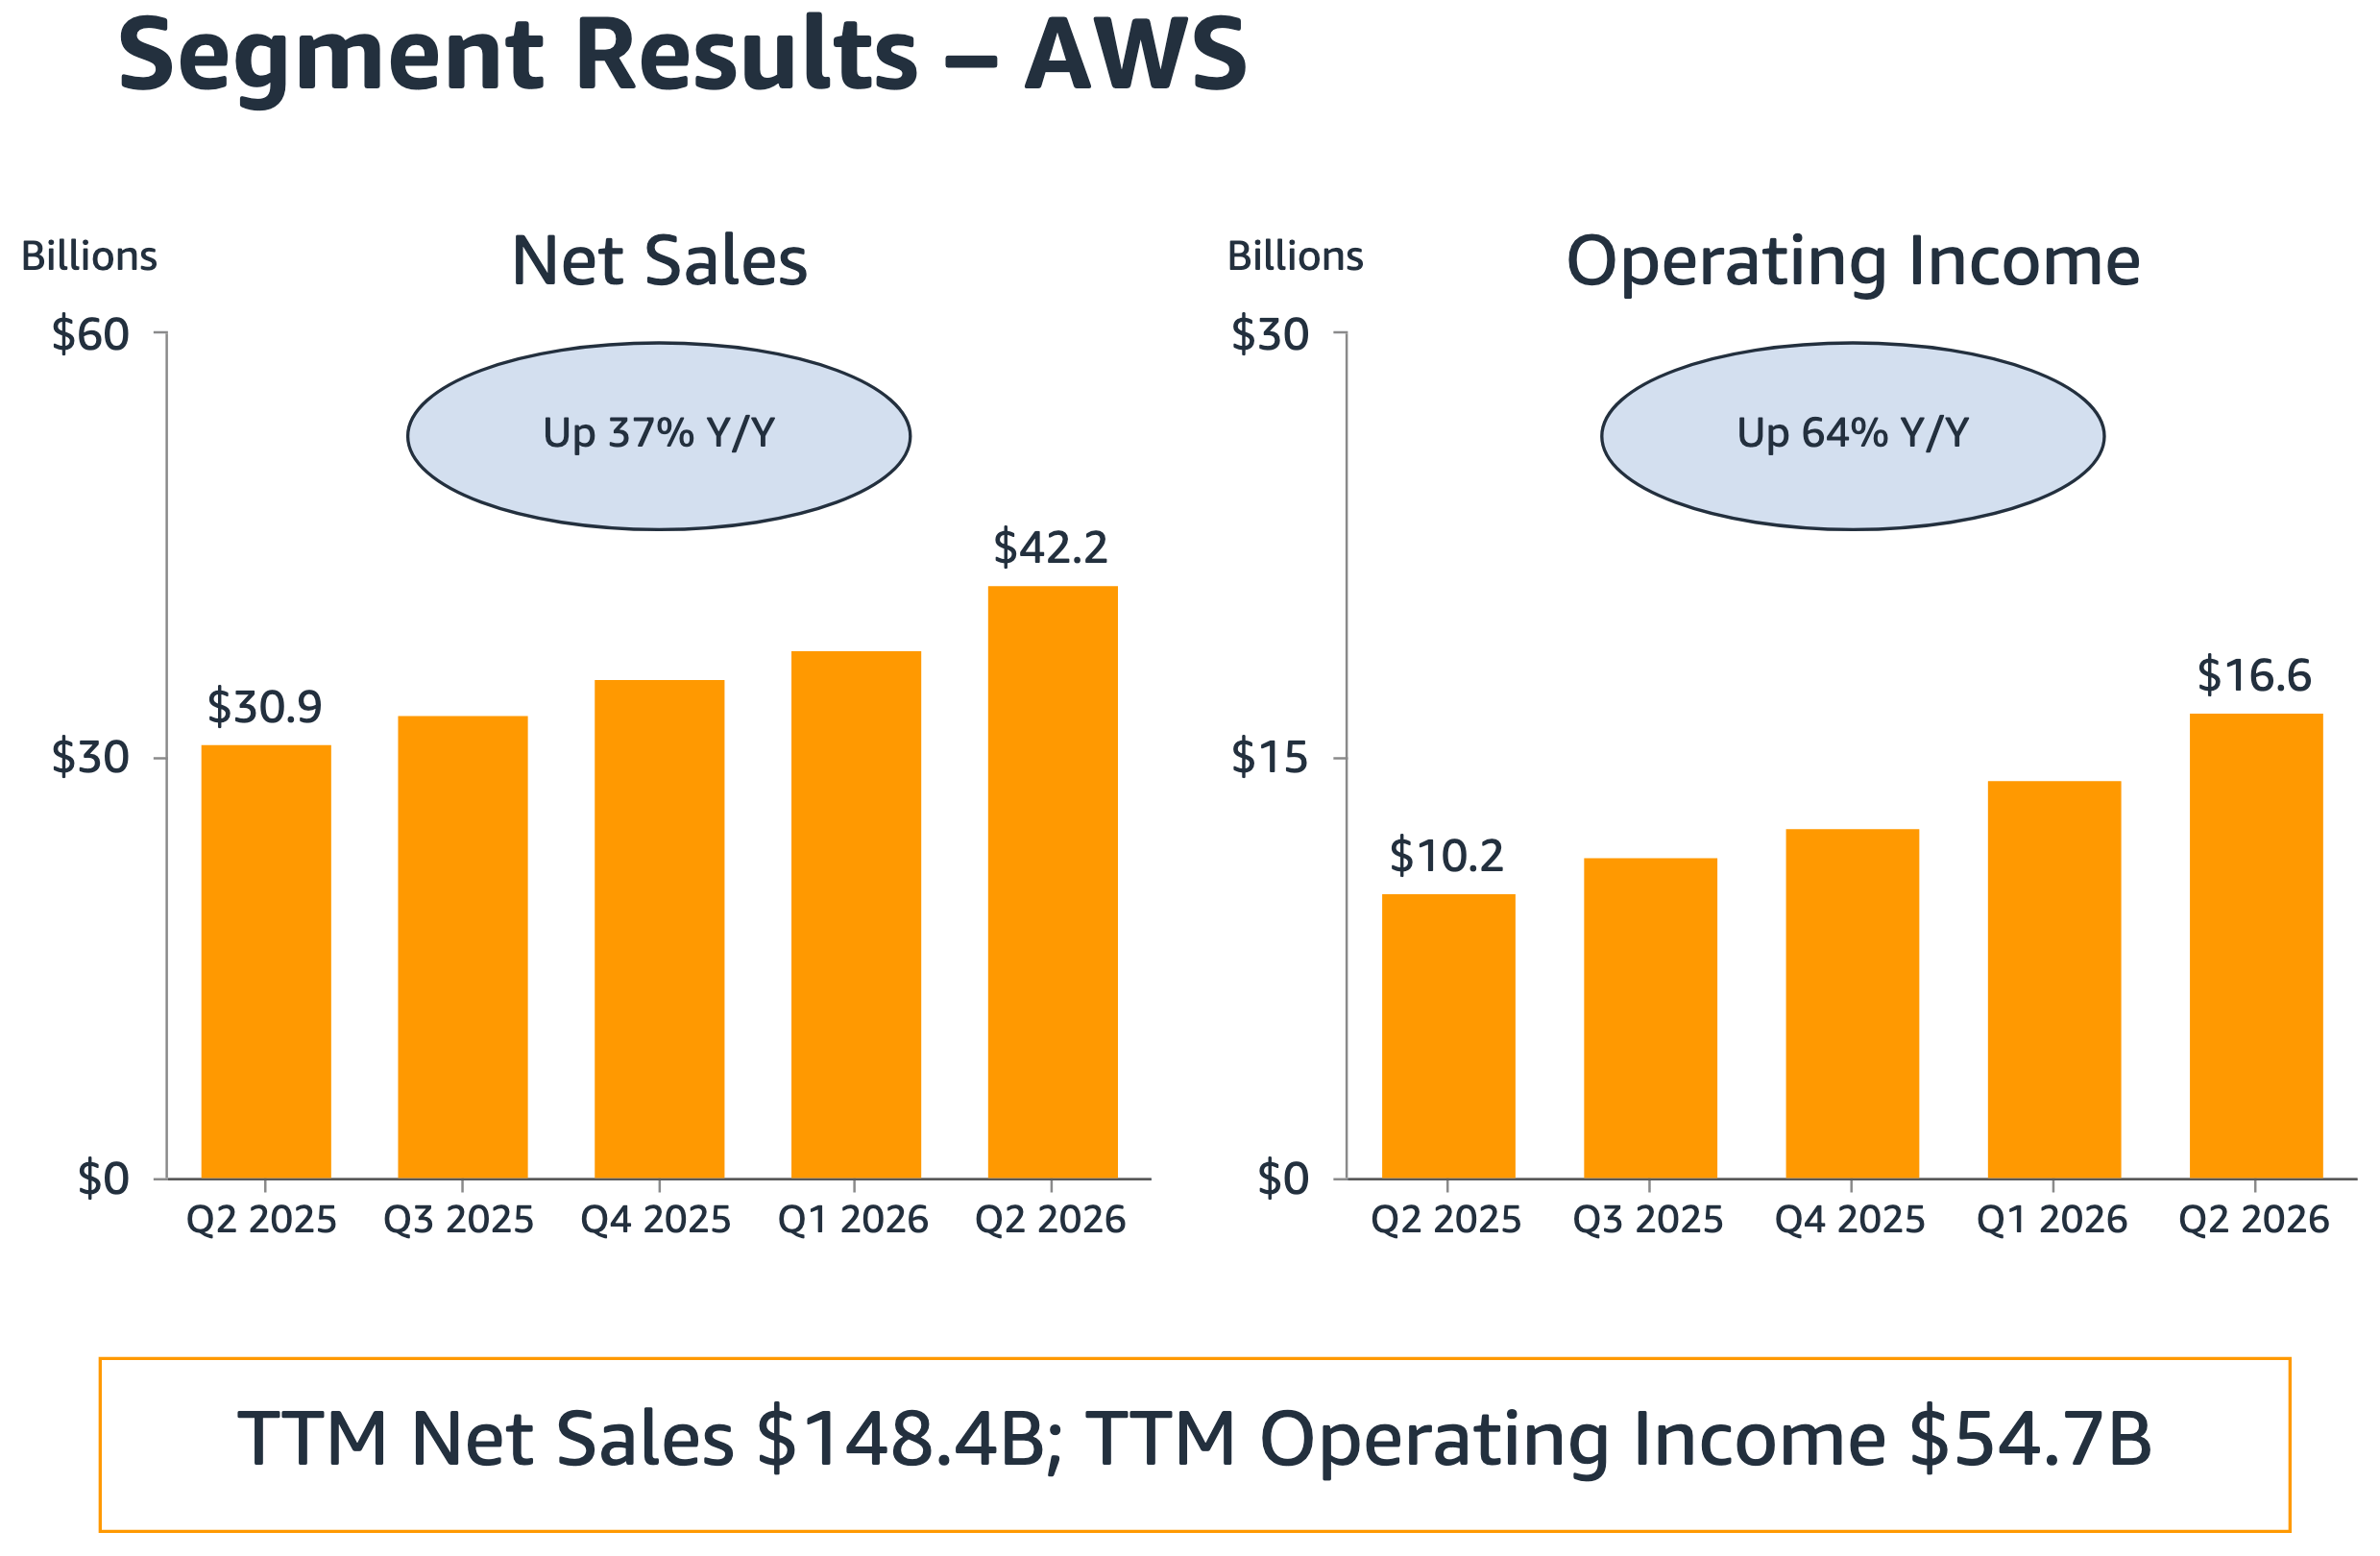
AWS carried the quarter: 36.7% growth, a 39.4% margin, and a $496 billion backlog: revenue of $42.2 billion runs at $168.9 billion annualized. As a standalone company that would rank 24th on the Fortune 500. Operating income of $16.6 billion grew 63.6%. CFO Brian Olsavsky said the energy-derivative benefit “primarily impacts the AWS segment”. Assuming $500 million landed there, clean AWS operating income was $16.1 billion, up 58.7%, on a 38.2% margin. That is 5.3% above last year and 0.5% above Q1. Remaining performance obligations1 (RPO) reached $496 billion, on contracts with a 6.4-year weighted-average remaining term. The AI business and the chips business each passed a $25 billion annual run rate, both growing triple digits.
Both profit engines accelerated together: this is the result that validates why I own Amazon. Retail monetizes through advertising. Paid units grew 17% and Prime engagement supplies the purchase-intent data that advertising converts at near-zero marginal cost. Advertising grew 26.2% to $19.8 billion, after four quarters at 22%. AWS is a separate business with a separate moat: scale, breadth, switching costs, and custom silicon. AWS now produces 21.1% of revenue and 60.5% of operating income, against 18.4% and 53% a year ago.
Q2 2026 lowlights
The shipping spread inverted: worldwide shipping costs grew 19% against 17% paid-unit growth. That ends 15 consecutive quarters in which units outgrew shipping costs.
North America’s clean margin fell: the reported 7.9% includes about $600 million of tariff refunds. Clean, the margin is nearer 7.3%, below Q1 2026.
Free cash flow turned negative: Net CapEx exceeded operating cash flow (OCF) for the first time, and TTM FCF swung $25.8 billion to -$7.6 billion.
Amazon funded growth with debt: Long-term debt nearly doubled in six months, and Note 4 of the 10-Q discloses about $286 billion of commitments that sit nowhere on the balance sheet.
Backlog concentration stays undisclosed: Amazon reports one number for $496 billion of contracted revenue. It names no customer and gives no concentration figure.
AWS grew faster and earned more
Jassy, on the call:
“Revenue growth of 36.7% year-over-year, accelerating for the fifth straight quarter, our fastest growth in 18 quarters back when AWS was less than half its current revenue size. We added over $4.6 billion in revenue quarter-over-quarter, about 80% more than our largest increase ever. Our backlog stands at $496 billion, growing triple digits year-over-year.”
The last time AWS grew at this rate it was an $80.1 billion business. RPO of $496 billion is 2.5x the $195 billion of Q2 2025, and equals 3.3x AWS TTM revenue. The revenue is contracted. Building capacity fast enough is the constraint.
For two years the bear case held that AI workloads would dilute cloud margins. Olsavsky answered it:
“The profitability you’re seeing from AWS isn’t random. It’s a result of disciplined efficiency gains, capacity optimization, which we benefited quite a bit from in Q2, and always closely managing our fixed costs.”
Jassy went further:
“We see the margins and returns in AI tracking what we saw with Core at the same point of evolution, actually a little ahead.”
That claim is easy to assert and hard to check. Two mechanisms make it true. First, the revenue mix moves up the stack, because renting raw capacity is the lowest-margin service AWS sells. Bedrock added more customers in the last six months than in its first two years after launch, and those customers spent more in Q2 than in all prior quarters combined. Second, every workload that shifts from Nvidia GPUs to Trainium or Graviton stops paying Nvidia’s margin and starts paying Amazon’s.
A third mechanism depends on enterprise adoption arriving on schedule, so I weight it least. Concentration falls as inference moves into production, because thousands of enterprise buyers cannot negotiate the way two AI labs can. That one I would bet on with the least confidence, and it is the mechanism the bear case should attack. Today’s 38.2% clean margin is earned on the least favorable mix AWS will see.
Two businesses sit underneath the AWS segment that barely appeared in the disclosure a year ago:
Chips, above a $25 billion annual run rate with triple-digit growth: above $20 billion three months ago. Graviton5 reached general availability at 30-40% better price-performance than comparable instances. Graviton runs at 98% of the top 1,000 EC2 customers, and revenue commitments rose nearly 3x quarter-over-quarter (QoQ). Trainium carries multi-year, multi-gigawatt commitments from Anthropic, OpenAI, Uber, and Pinterest.
AI services, above a $25 billion annual run rate with triple-digit growth: hundreds of thousands of customers use Bedrock, and Kiro tripled usage sequentially.
AI demand also raises core AWS consumption
“Growth in AI drives Core because post-training reinforcement learning and agent tool use is mostly done on CPUs versus AI accelerators.” - Andy Jassy
Agents consume more than GPU accelerators. They need CPUs to orchestrate, storage to hold memory, databases for context, and proximity to enterprise data. All of that is core AWS.
On Microsoft’s FY26 Q4 earnings call on July 29, CEO Satya Nadella said the same thing:
“When it comes to running agents, CPUs are just as important as GPUs.” - Satya Nadella
Microsoft is scaling its own Cobalt CPUs against that demand. Two cloud providers described one mechanism a day apart, and both are building silicon to serve it. AI spending multiplies the rest of AWS rather than sitting beside it.
How AWS compares with Azure and Google Cloud
Per Synergy Research Group, cloud infrastructure spending grew 43% in Q2 to $143 billion, the eleventh consecutive quarter of accelerating growth. AWS held 28% market share against Microsoft Azure at 20% and Google Cloud at 15%.
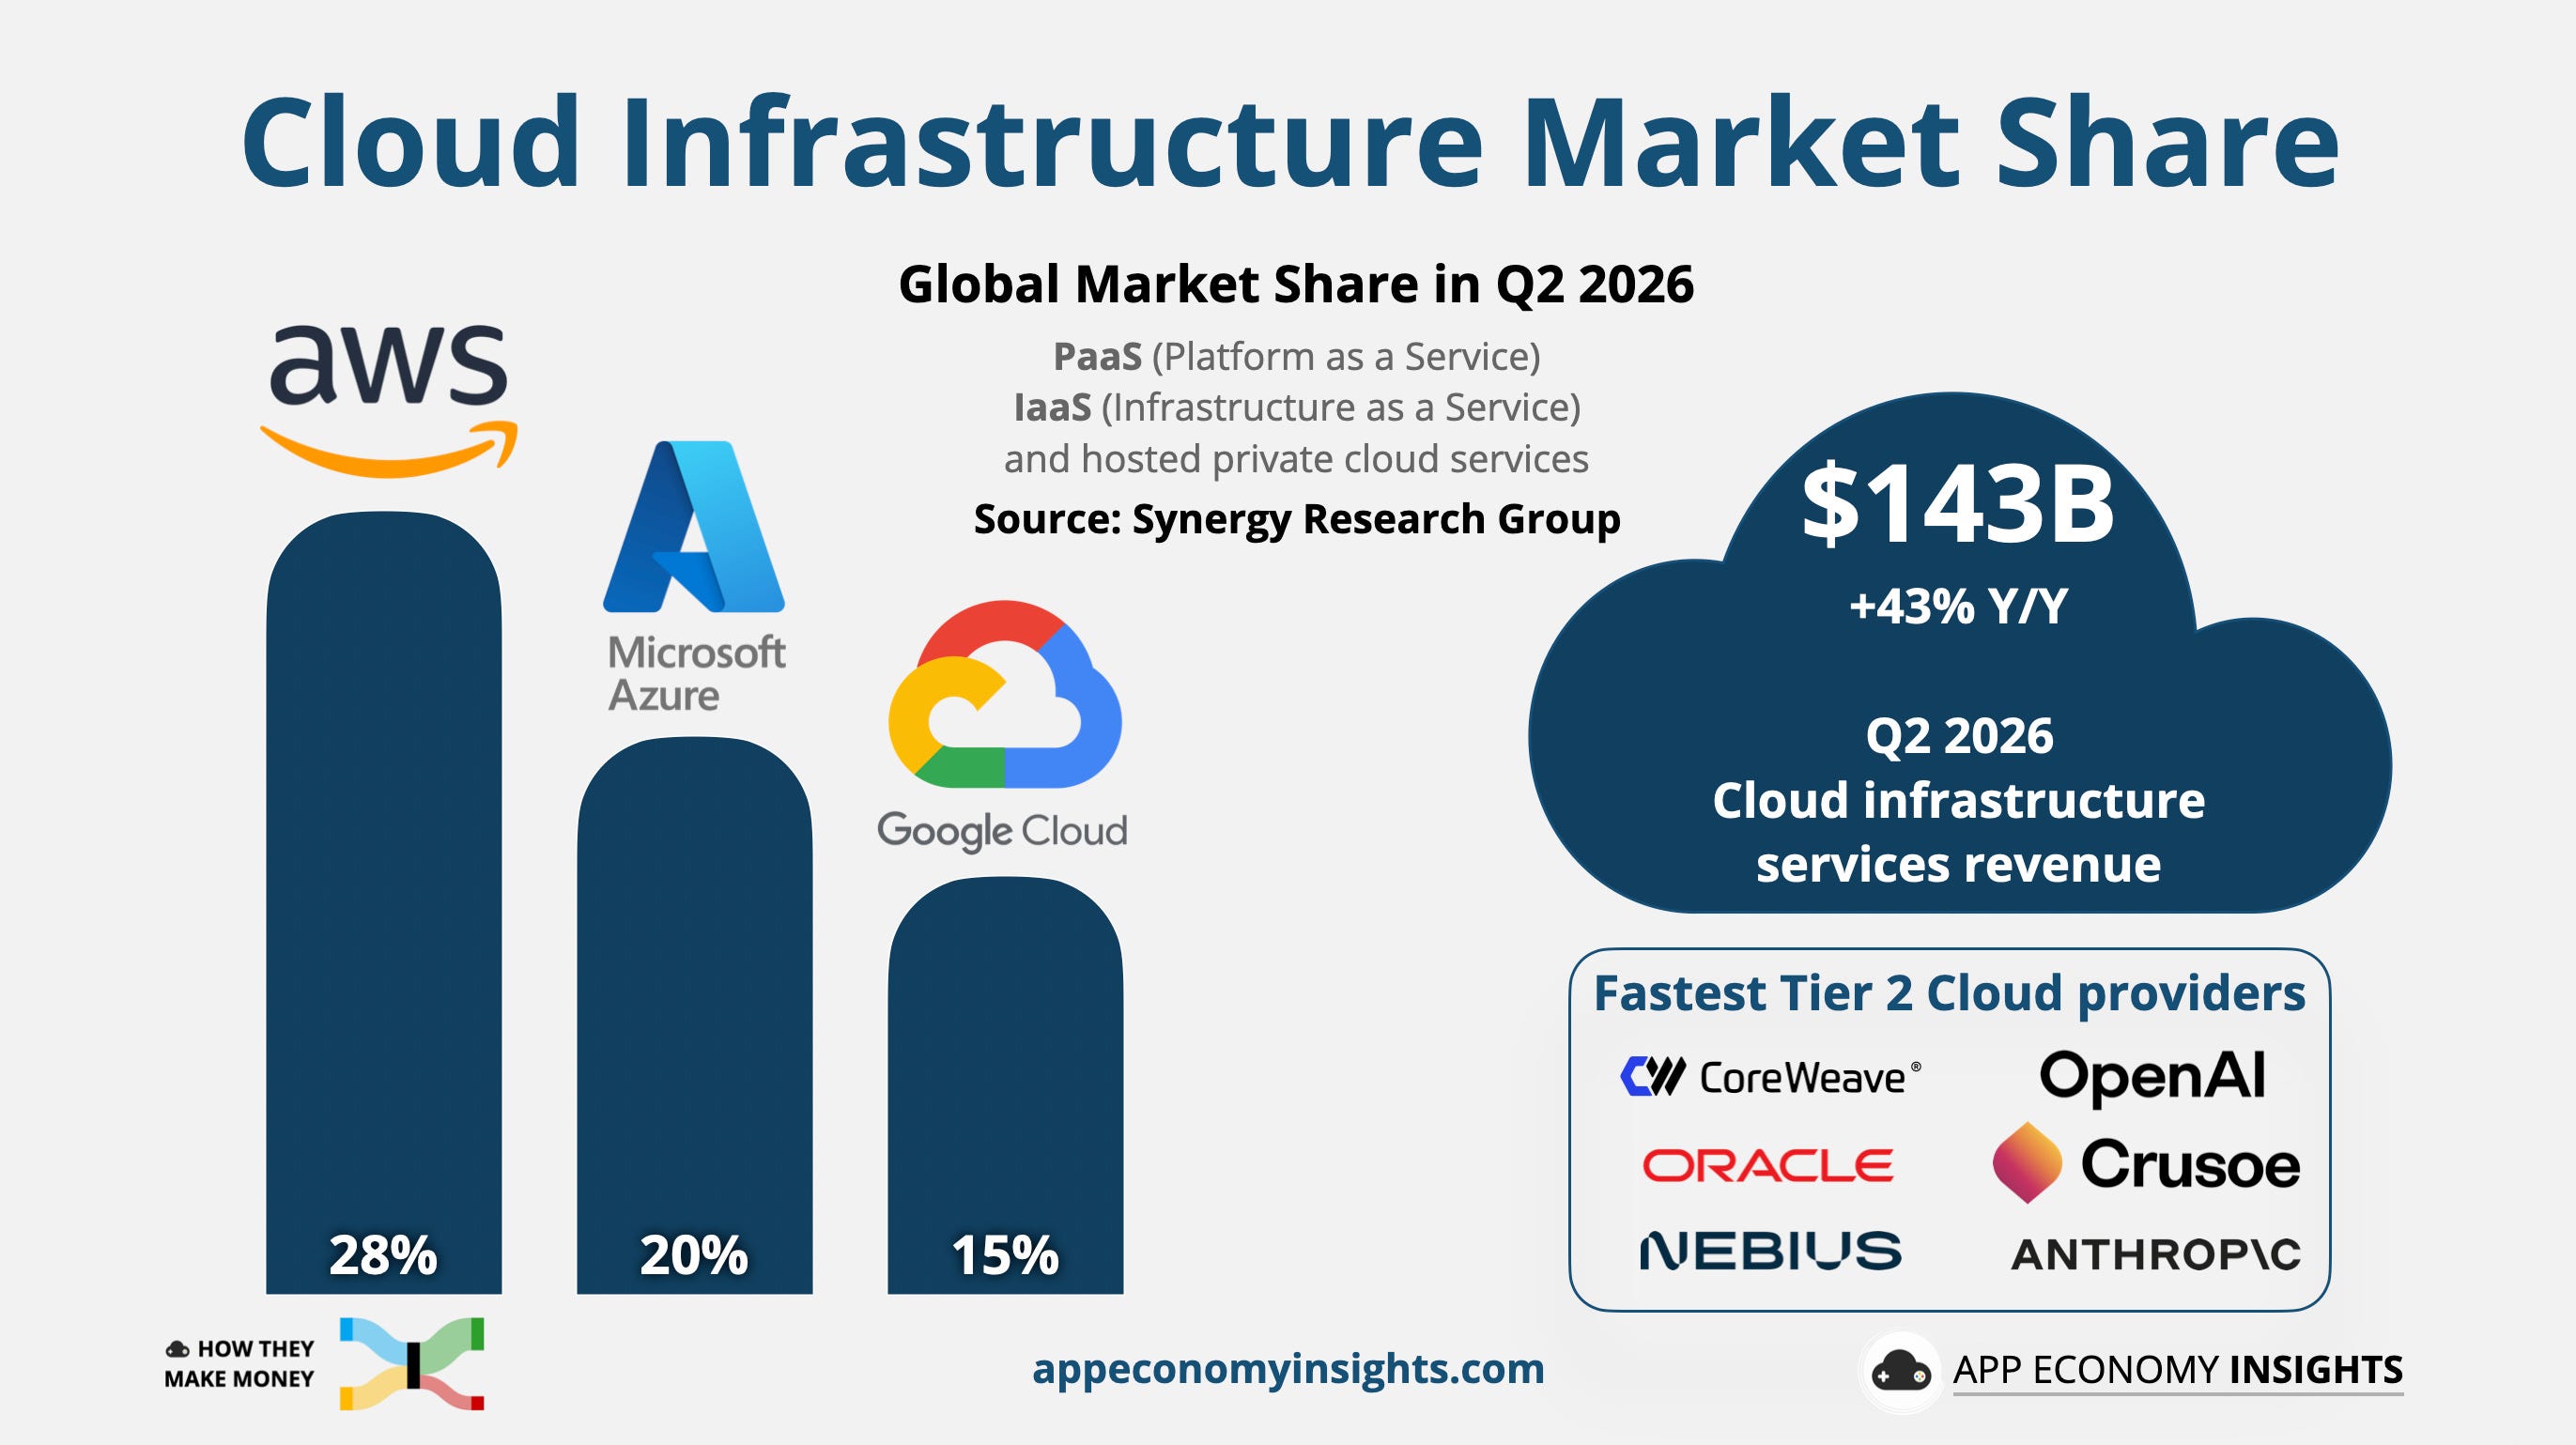
All three providers are supply-constrained, so quarterly share moves carry little information. The market is reaccelerating while the leader holds market share and raises margin.
Who signed the $496 billion backlog
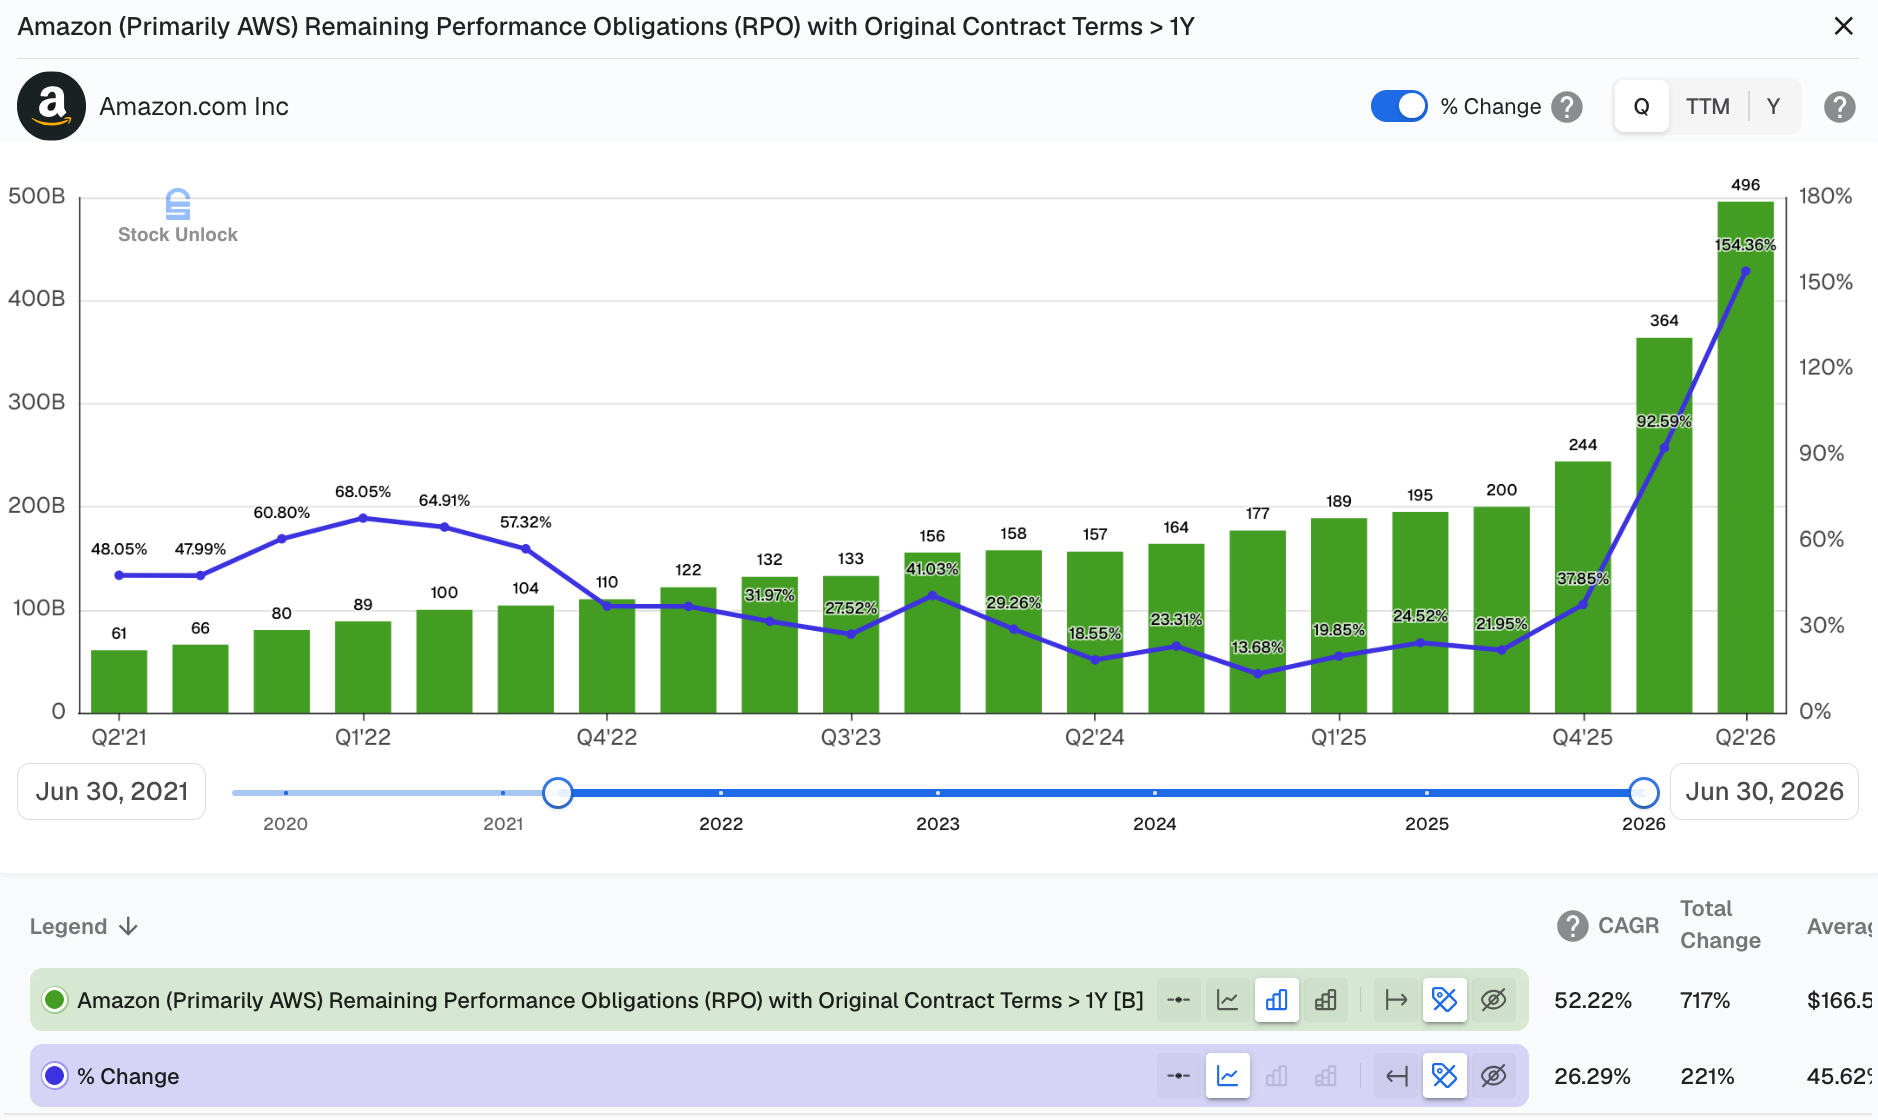
This is the question I wanted answered, and Amazon did not answer it. The 10-Q gives one number and a 6.4-year weighted-average term2. It names no customers.
In Q1 2026 AWS and OpenAI expanded an existing $38 billion commitment by $100 billion over eight years. In Q2 2026 AWS and Anthropic expanded theirs by more than $100 billion over 10 years. Both explicitly include AWS chips. The backlog grew $252 billion in the first half of 2026, so those two agreements plausibly account for more than $200 billion of it. A backlog is worth the credit standing behind it, and this quarter left that unanswered. I cover it separately.
The CapEx guidance raise
Jassy on the call:
“We now believe we will spend approximately $220 billion in cash CapEx in 2026. The higher cost of memory pushing this number up from our prior estimate of about $200 billion. Even at that amount, we will still not have enough capacity to meet all the demand we have in 2026, and I believe this dynamic will also be true in 2027, too. In fact, the demand we already have for 2028 is striking.”
This is the supply-constrained signal from Invert the Market’s AI CapEx Panic article. The $20 billion increase adjusts for cost inflation in memory. It buys no additional capacity. Capacity for 2027 is already committed, and commitments extend into 2028.

The ceiling moved as well:
“We long believed AWS could become a few hundred billion-dollar revenue business and now believe it’ll be at least double that, and very possibly be a trillion-dollar annual revenue business for us in time, with very appealing accompanying free cash flow and return on invested capital.” - Andy Jassy
A trillion dollars is 5.9x the current $168.9 billion run rate. One figure supports the path: 85% of global information technology spending still runs on premises. Jassy’s “barbell” describes the demand: AI labs and consumer applications at one end, narrow enterprise automation at the other, and between them:
“In the middle of the barbell is all of the current enterprise production workloads, some of which are using inference in a pervasive way, but most of which aren’t. That is going to change very significantly over time. In my opinion, that will be the largest absolute segment […].”
The return math Amazon disclosed
This is the passage that repriced the stock. Jassy, on the call:
“For servers and networking equipment, on average, it takes a little less than three years to break even on that investment. The servers currently have a useful life of at least five to six years, and most of our AI capacity these days is being contracted for at least five-year terms.”
A payback under three years on assets that run five to six years is a good return, and Amazon had never shown it before. Jassy costed the servers. He did not cost the buildings holding them, and the building is the 30-year asset the thesis rests on. I reconstructed the missing half from the filings. The buildout clears my 10% internal rate of return (IRR) hurdle3. It clears it on the durability of the data center, not the returns of the servers. That is a different thesis from the one the quote implies, and it is the one I am underwriting. I set out the full calculation in another article.

Stores and advertising keep compounding
Retail accelerated on every top-line measure. What it cost to run the delivery network is the one line that moved the wrong way.
Online stores revenue grew 15%, up from 9% in Q1 2026. Third-party seller services grew 16% and paid units 17%.
Speed improved at scale. Amazon delivered over 40% more items same-day or overnight in the first half, and monthly active perishables customers rose 50% since January.
Grocery is a real business. Gross sales exceeded $150 billion in 2025, making Amazon the second-largest grocer in the United States.
Automation runs ahead of the expectations I set in Amazon Catalysts in 2026 and Beyond. Olsavsky said Amazon expects to more than double its fleet of robotic arms in 2026. Headcount grew 3% against 20% revenue growth, which is the proof.

North America stalled, International improved
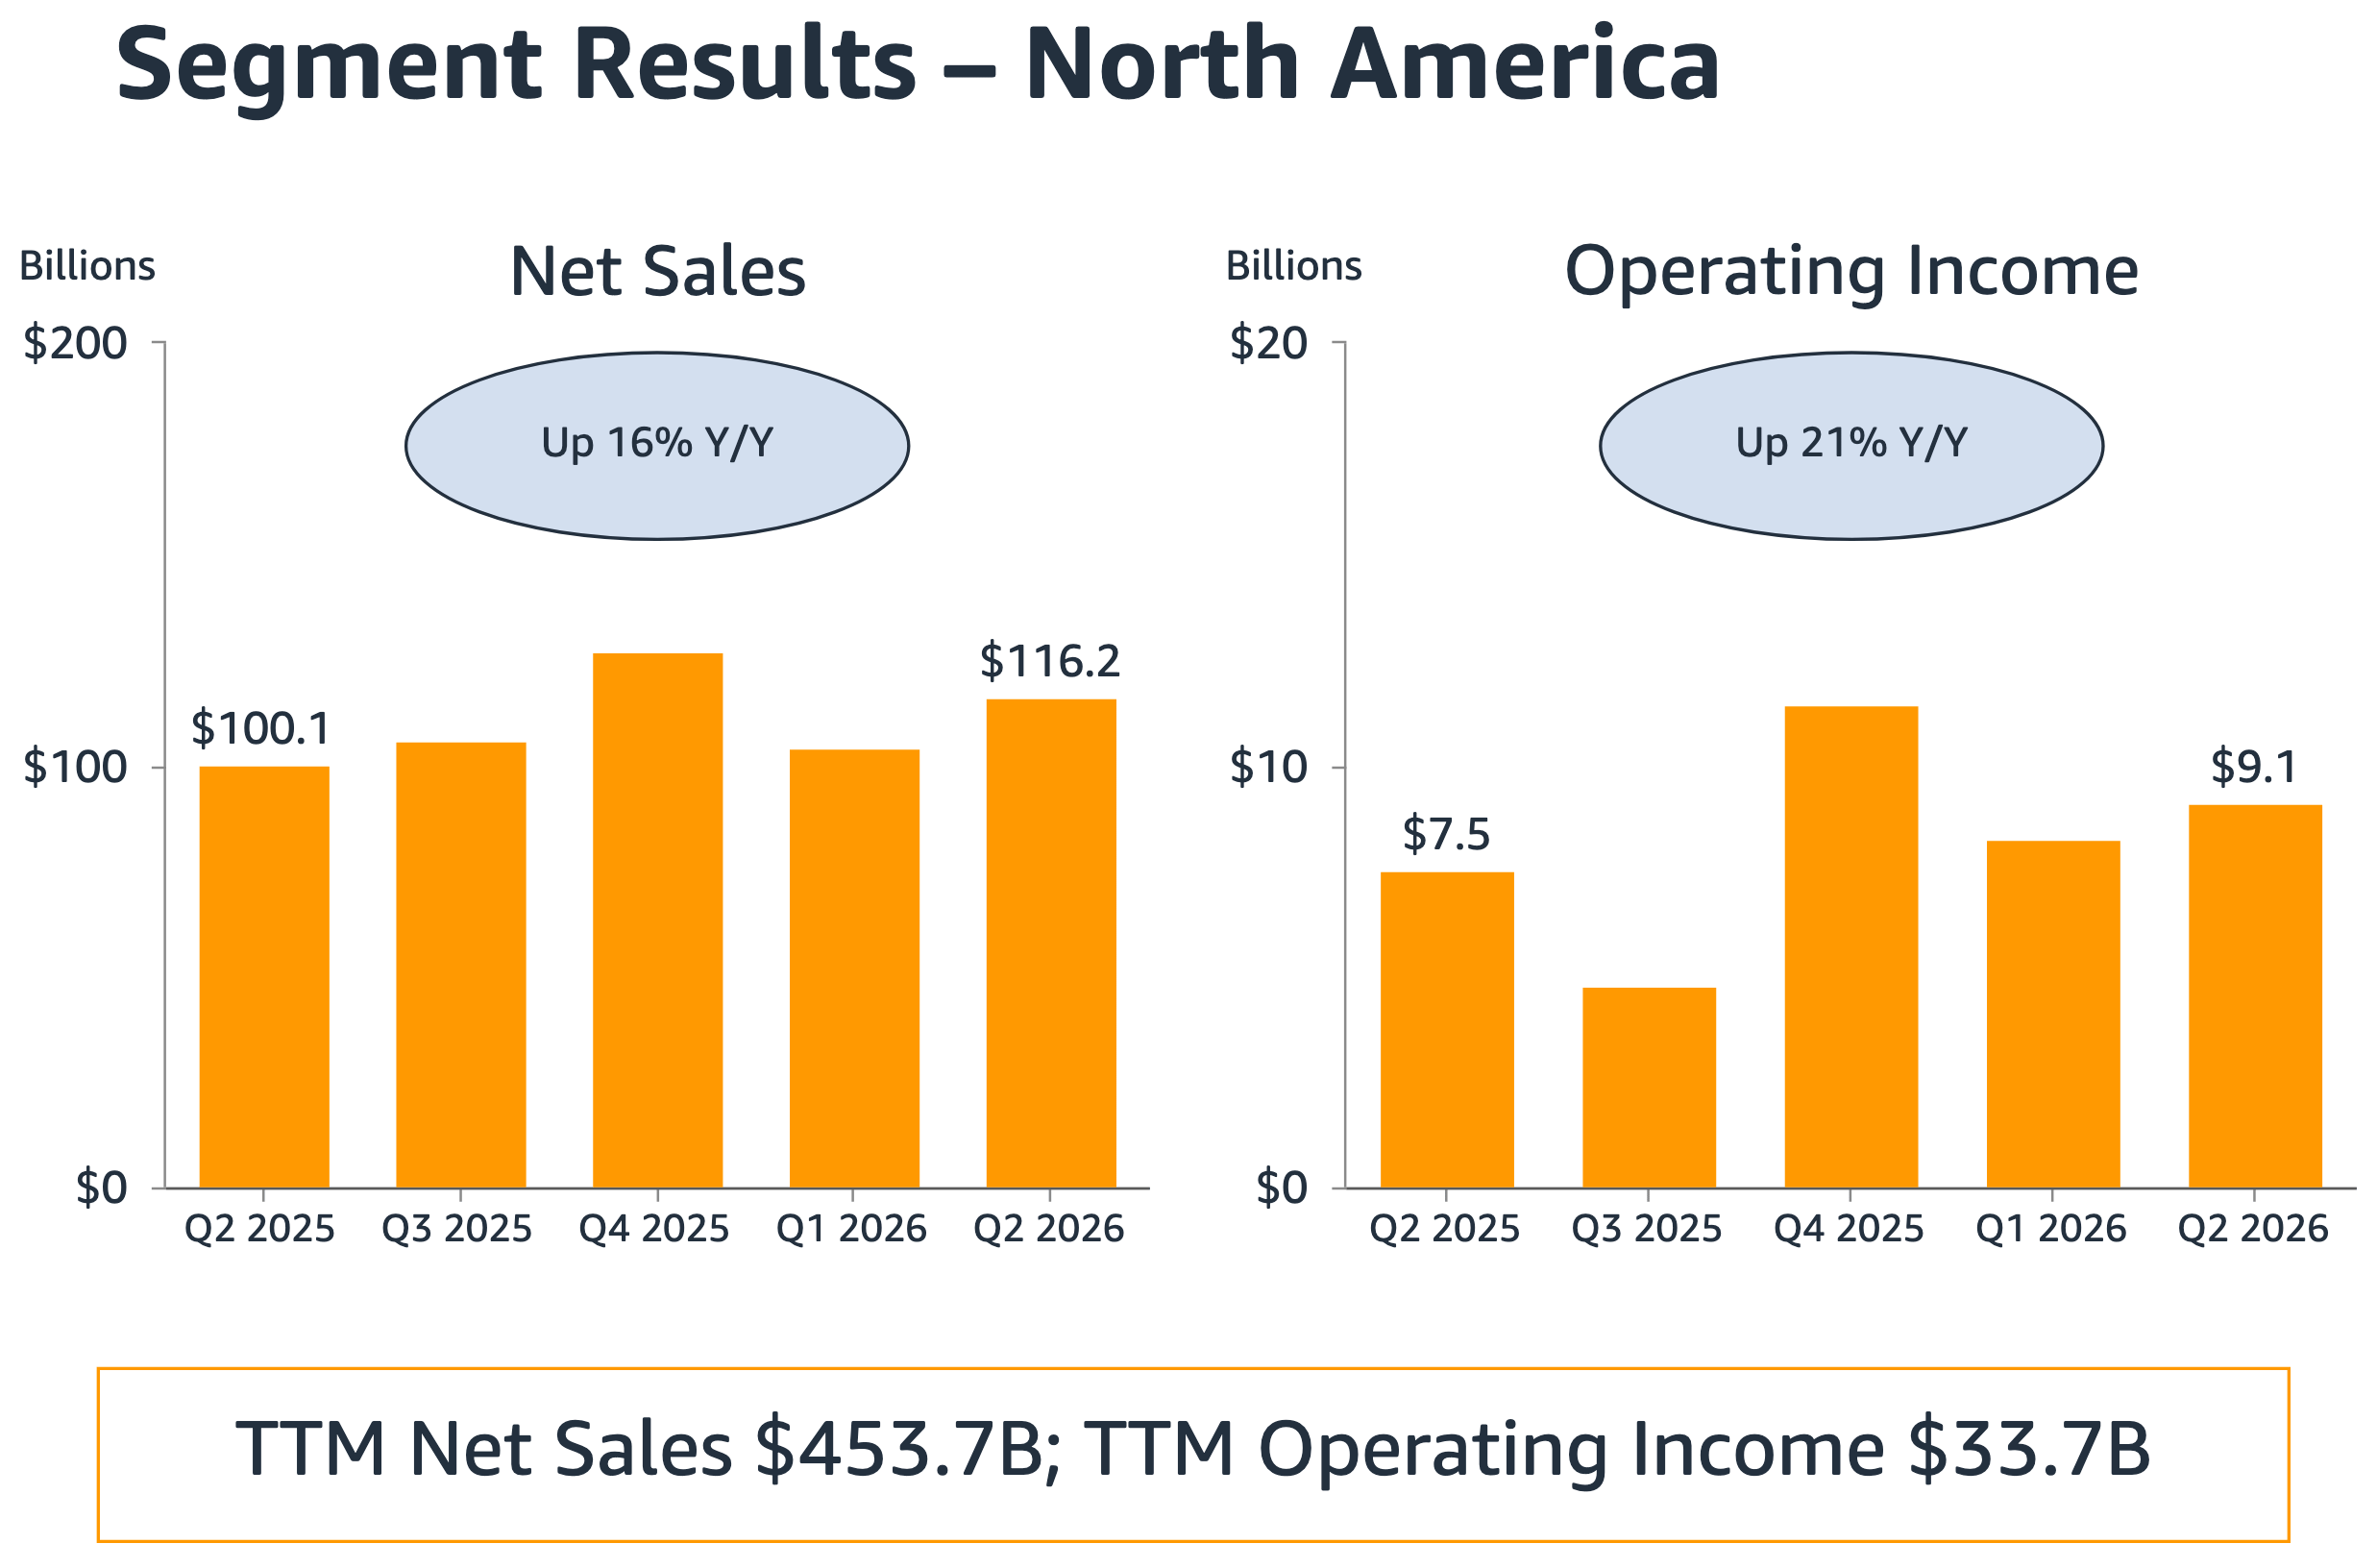
North America grew 16% to $116.2 billion with $9.1 billion of operating income, up 21%. The reported 7.9% margin includes the tariff refunds. Clean, it is nearer 7.3%, below Q1 2026. Demand accelerated. The retail cost advantage did not widen.
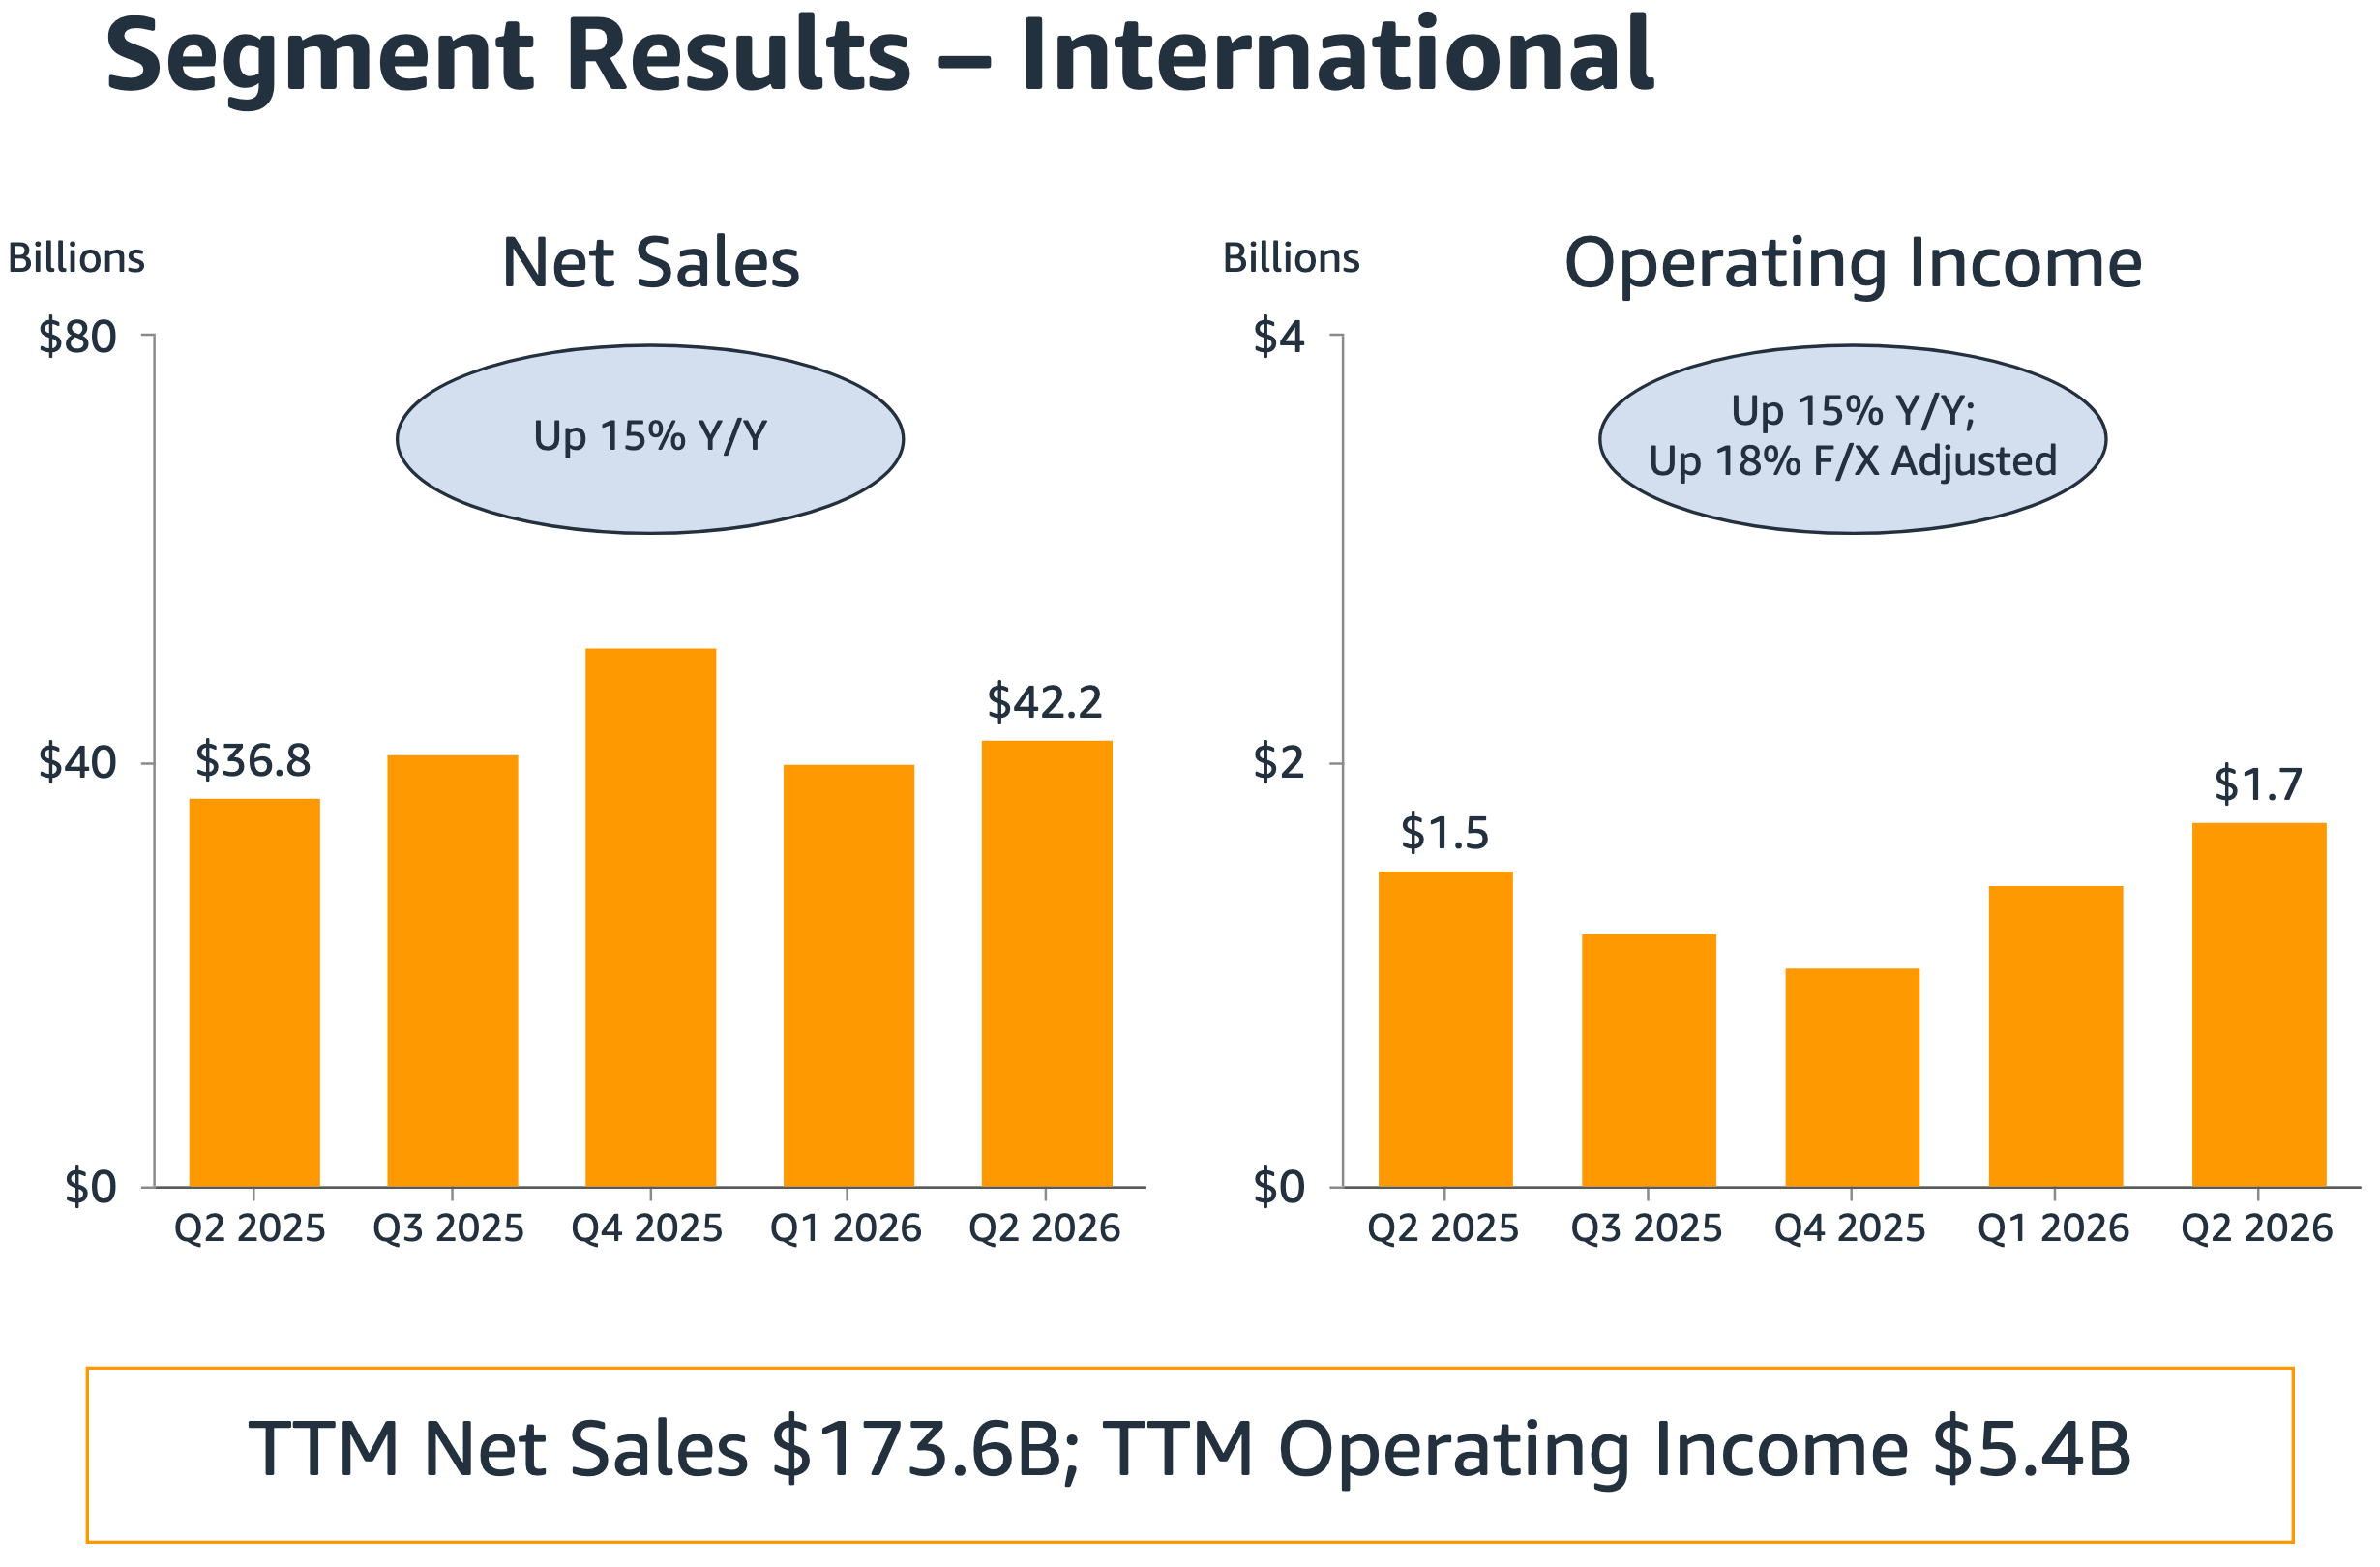
International moved the other way. Revenue grew 15% to $42.2 billion and operating income grew 15% to $1.7 billion. Margin reached 4.1%, up from 3.6% in Q1 and matching the best quarter in two years.
Retail’s size magnifies both margin and cost
Quarterly retail revenue of $158.4 billion is 3.8x the $42.2 billion AWS produced. One percentage point of retail margin is about $1.6 billion a quarter, which is why the robotics program and the shipping cost line both deserve attention.
Worldwide shipping costs grew 19% against 17% paid-unit growth. For 15 straight quarters, paid units outgrowing shipping costs was my evidence that the retail network kept gaining efficiency. That spread inverted this quarter.
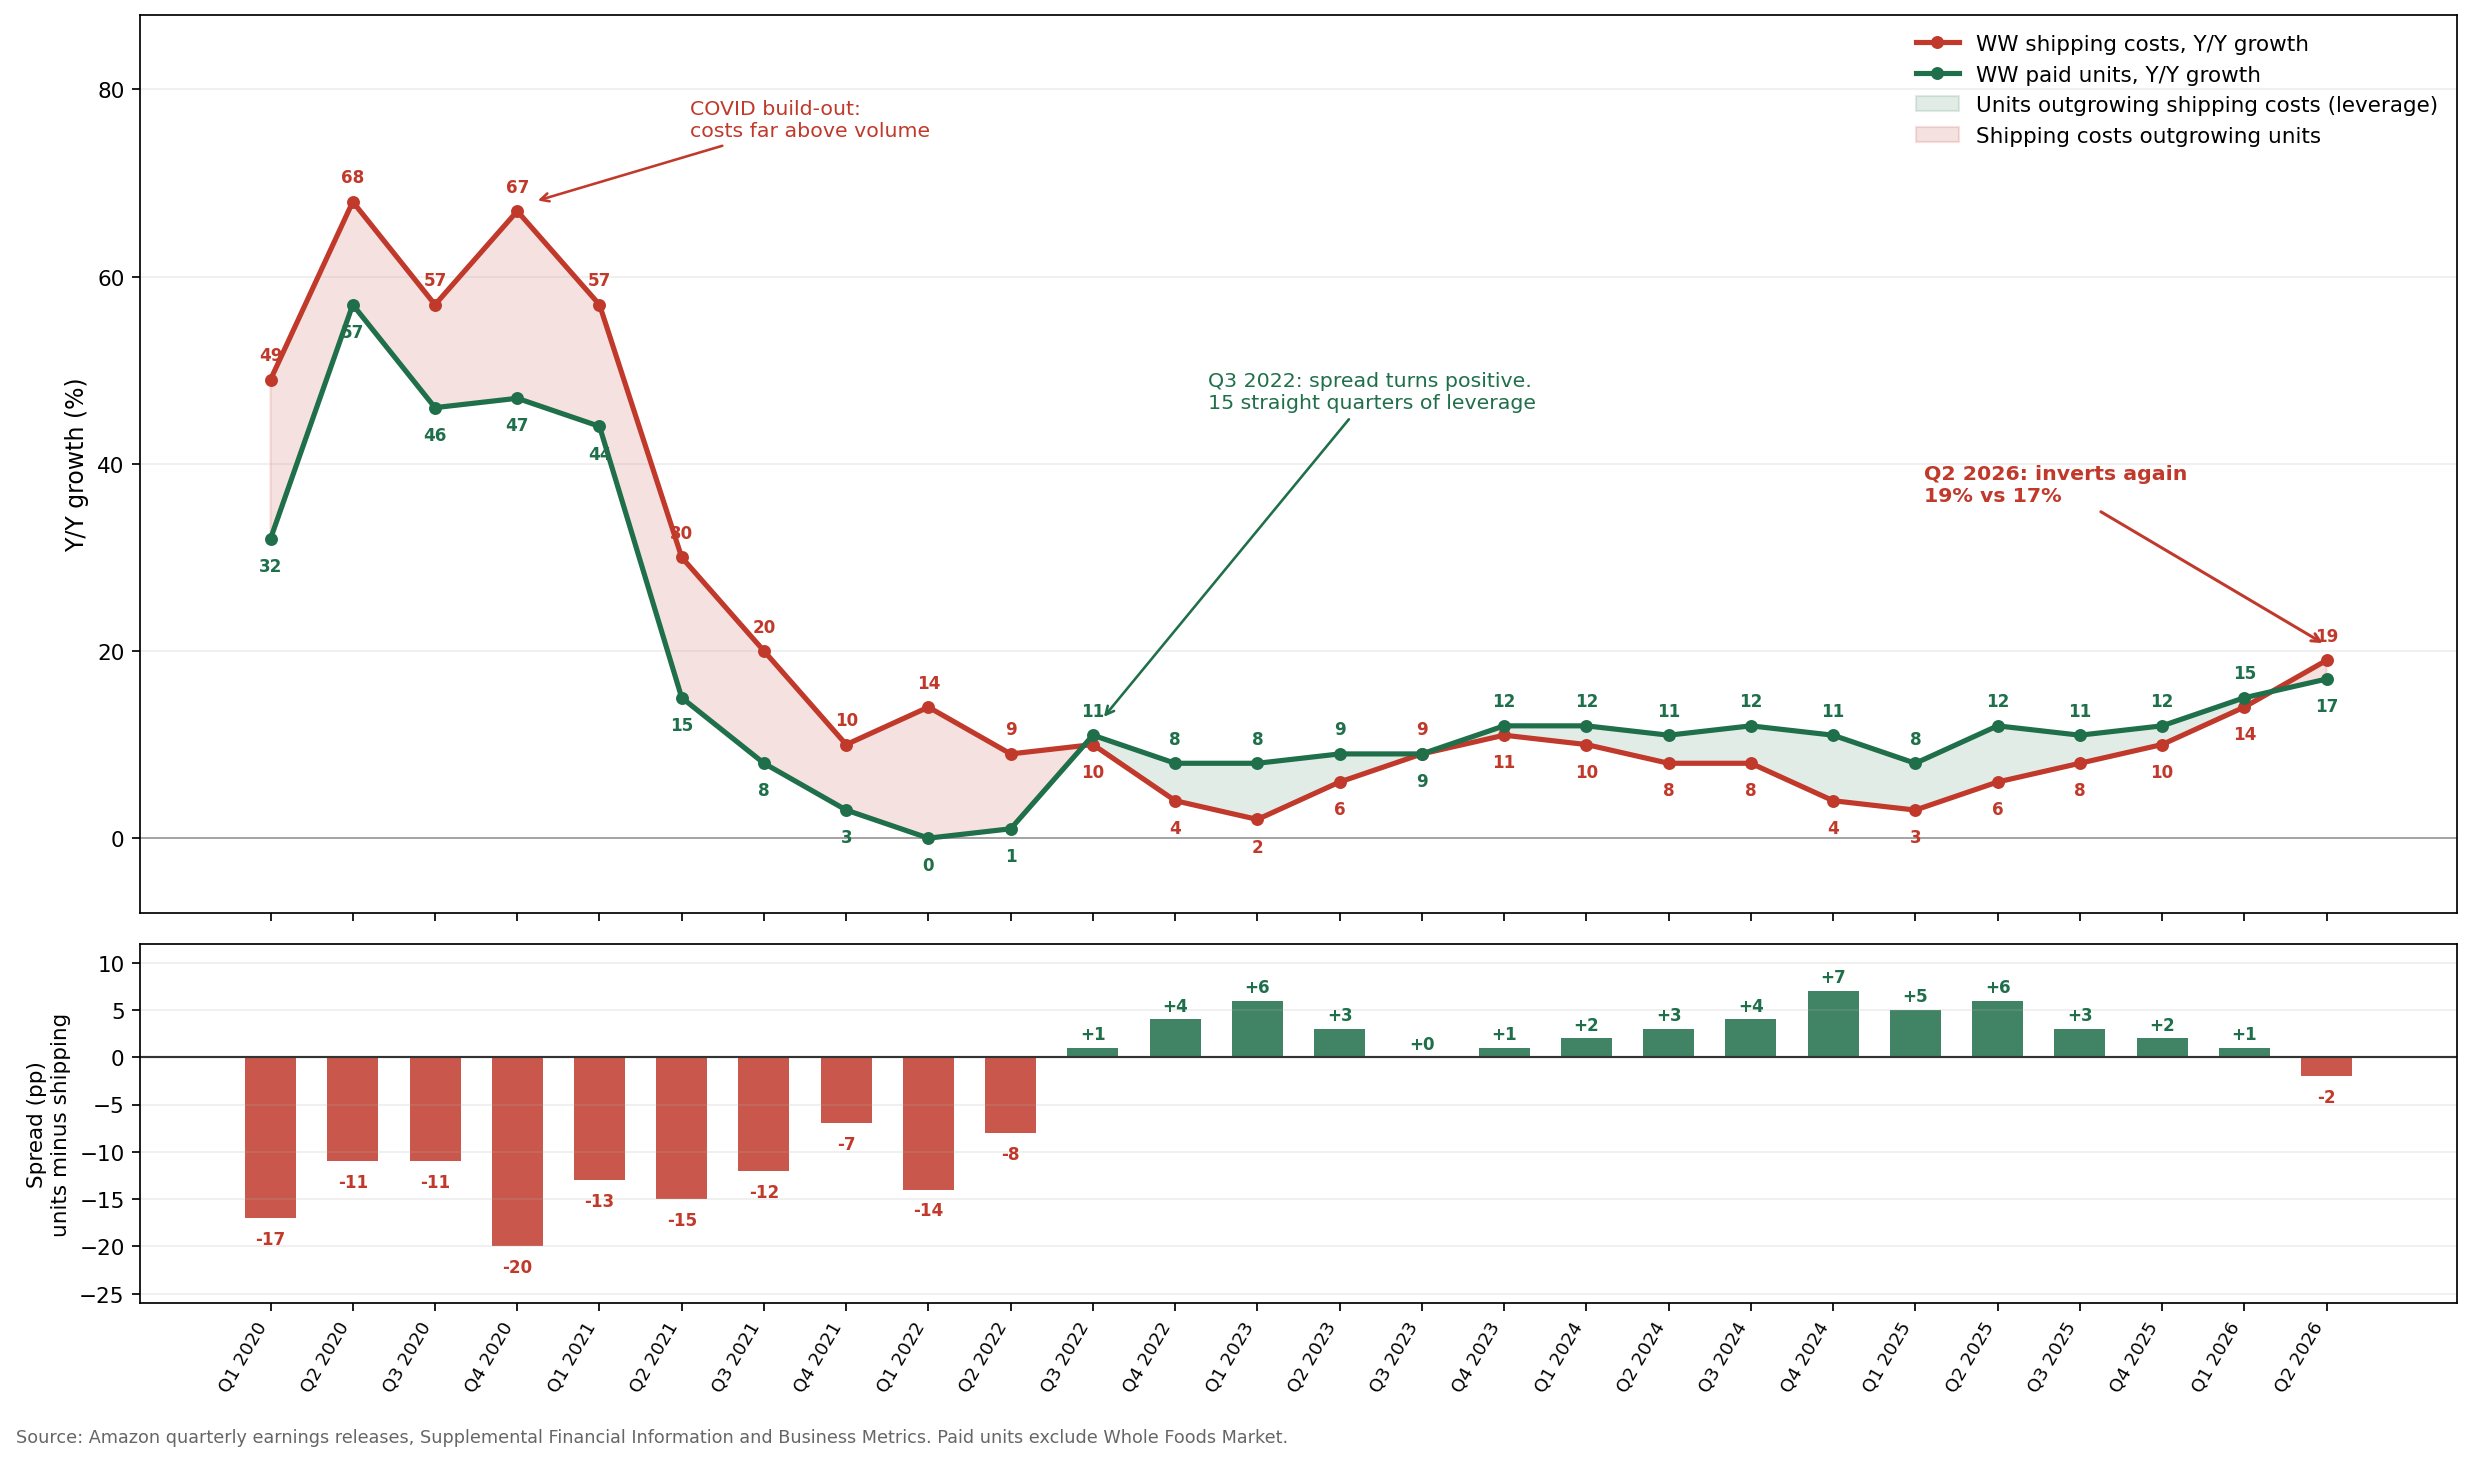
Amazon ran 10 consecutive inverted quarters from Q1 2020 to Q2 2022, building capacity ahead of volume. The spread then turned positive and stayed positive for 15 quarters.
Olsavsky attributed this inversion to fuel inflation and line-haul rates rising with driver capacity limits. Excluding fuel and line haul, he said shipping cost growth stayed below unit growth.
That explanation works for one quarter. It sits less comfortably against the trend. The spread peaked at +7 points in Q4 2024, then ran +5, +6, +3, +2, +1, and now -2. A year of steady compression does not match a fuel shock.
Advertising monetizes the retail base
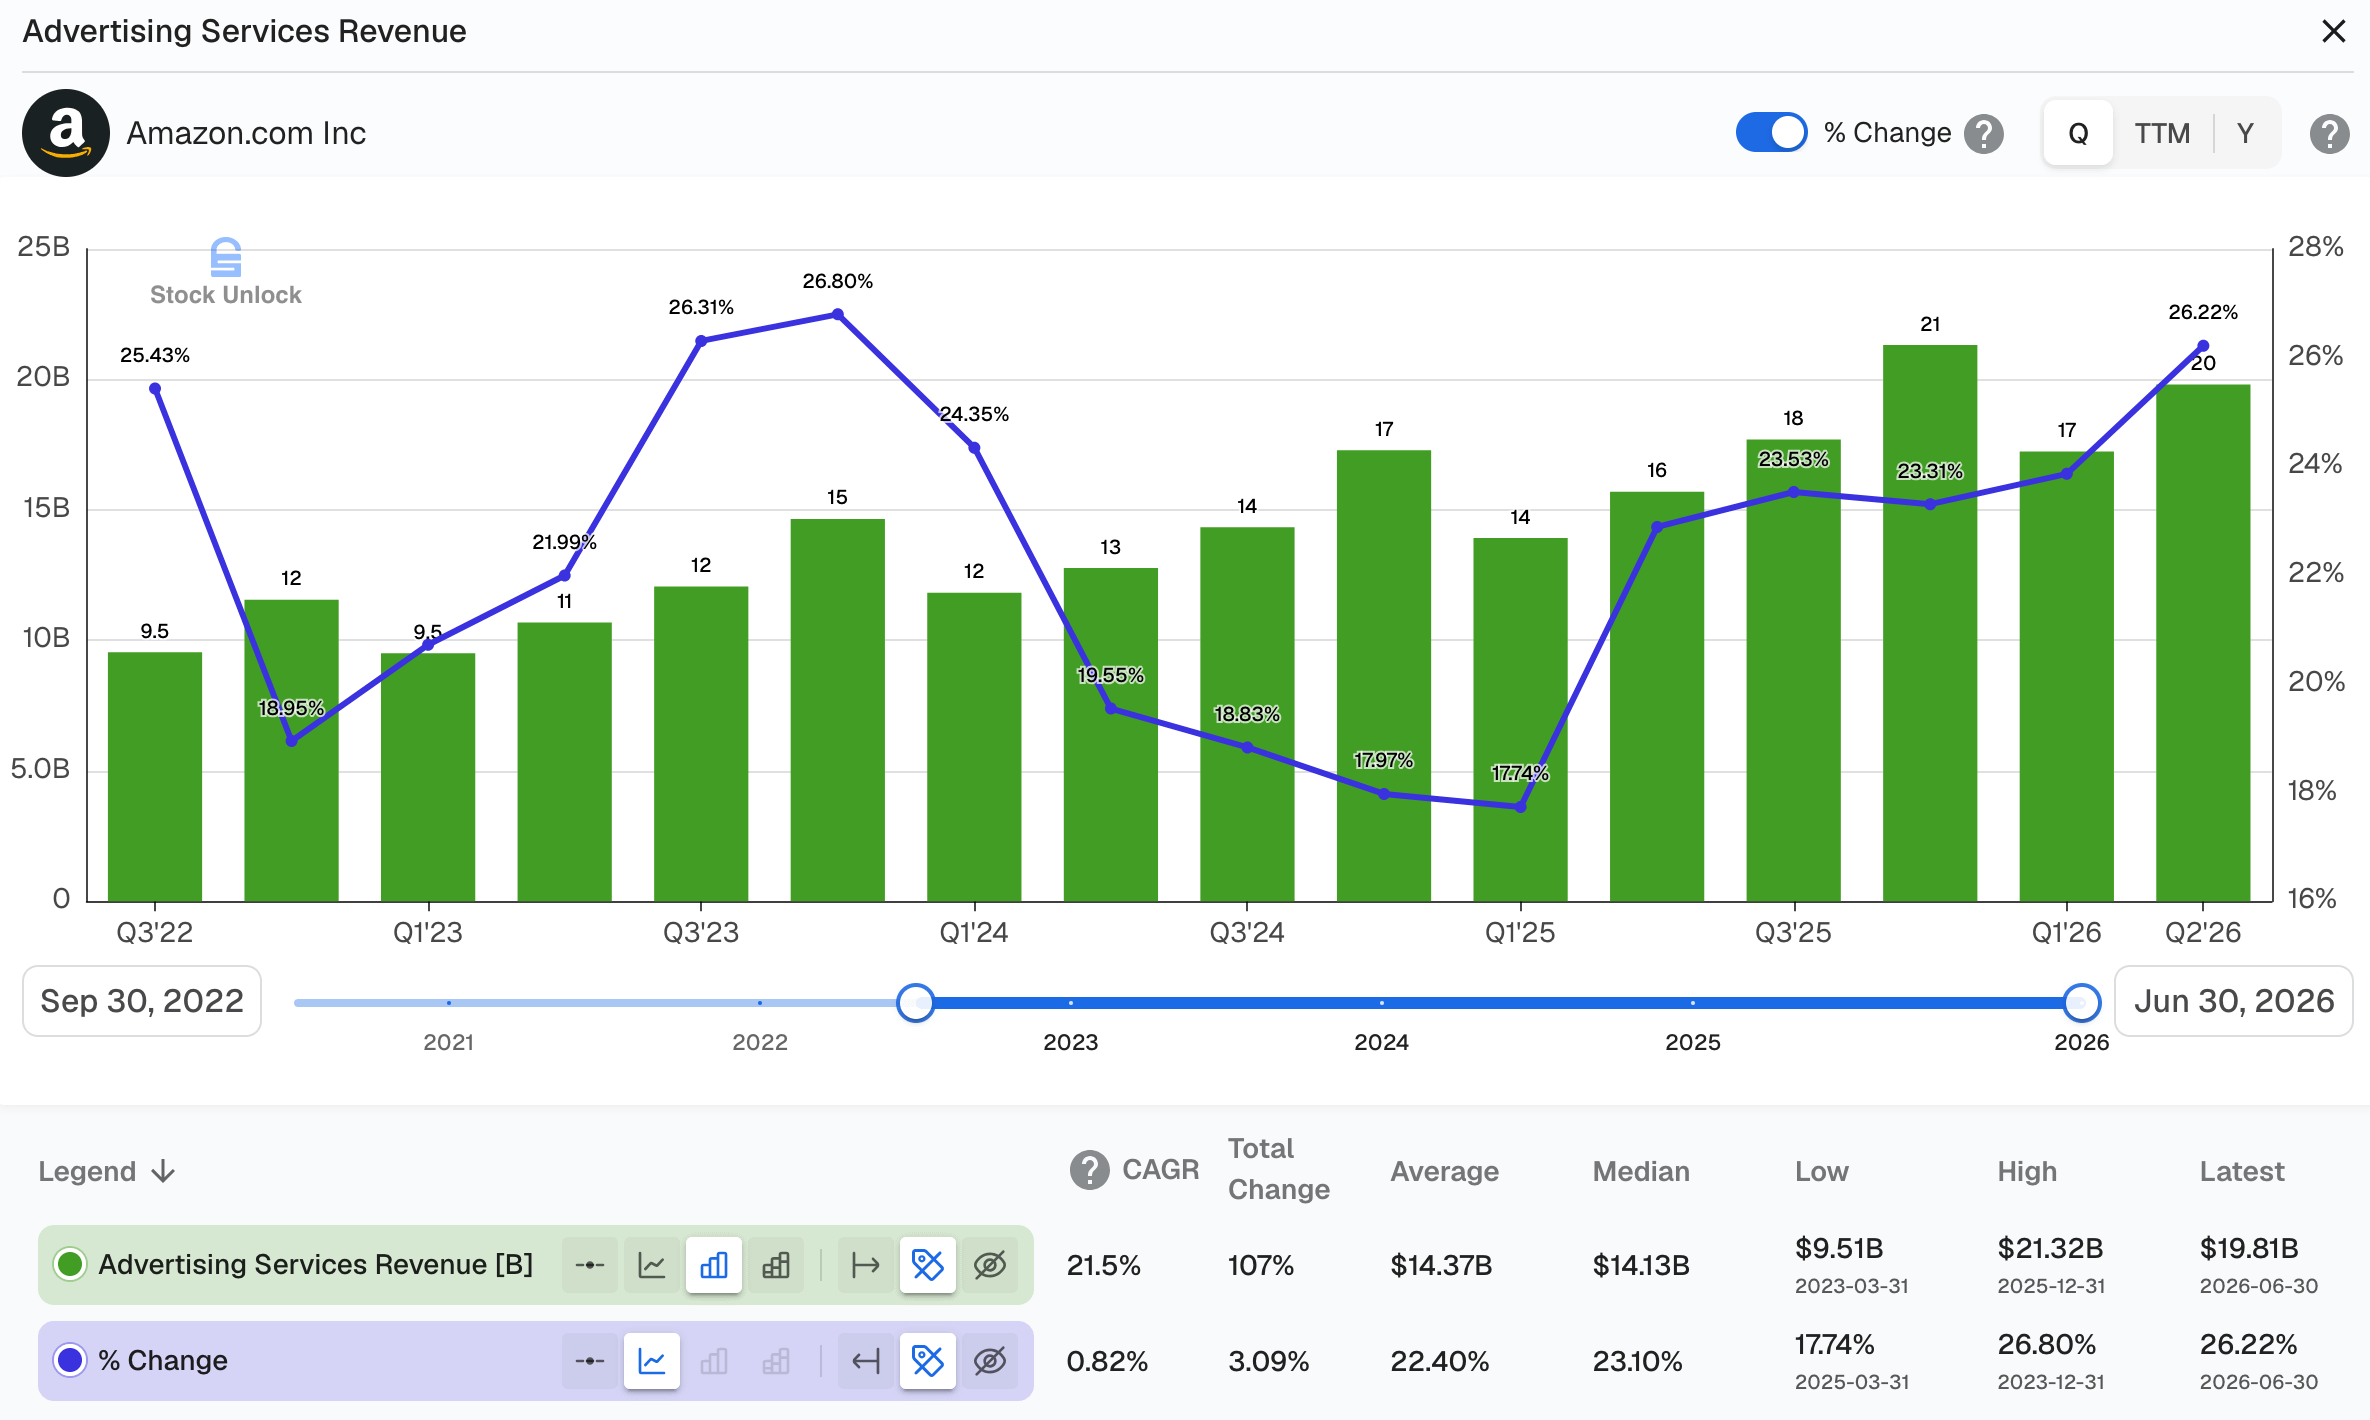
Advertising grew 26.2% to $19.8 billion, accelerating from four quarters at 22%, and now runs at $76 billion of trailing revenue. New AI surfaces feed it. Jassy said “over 350 million customers have used” Alexa for Shopping in the last 12 months. In the United States, those customers spend over 40% more per order than customers who do not use it.
Negative free cash flow is a construction schedule
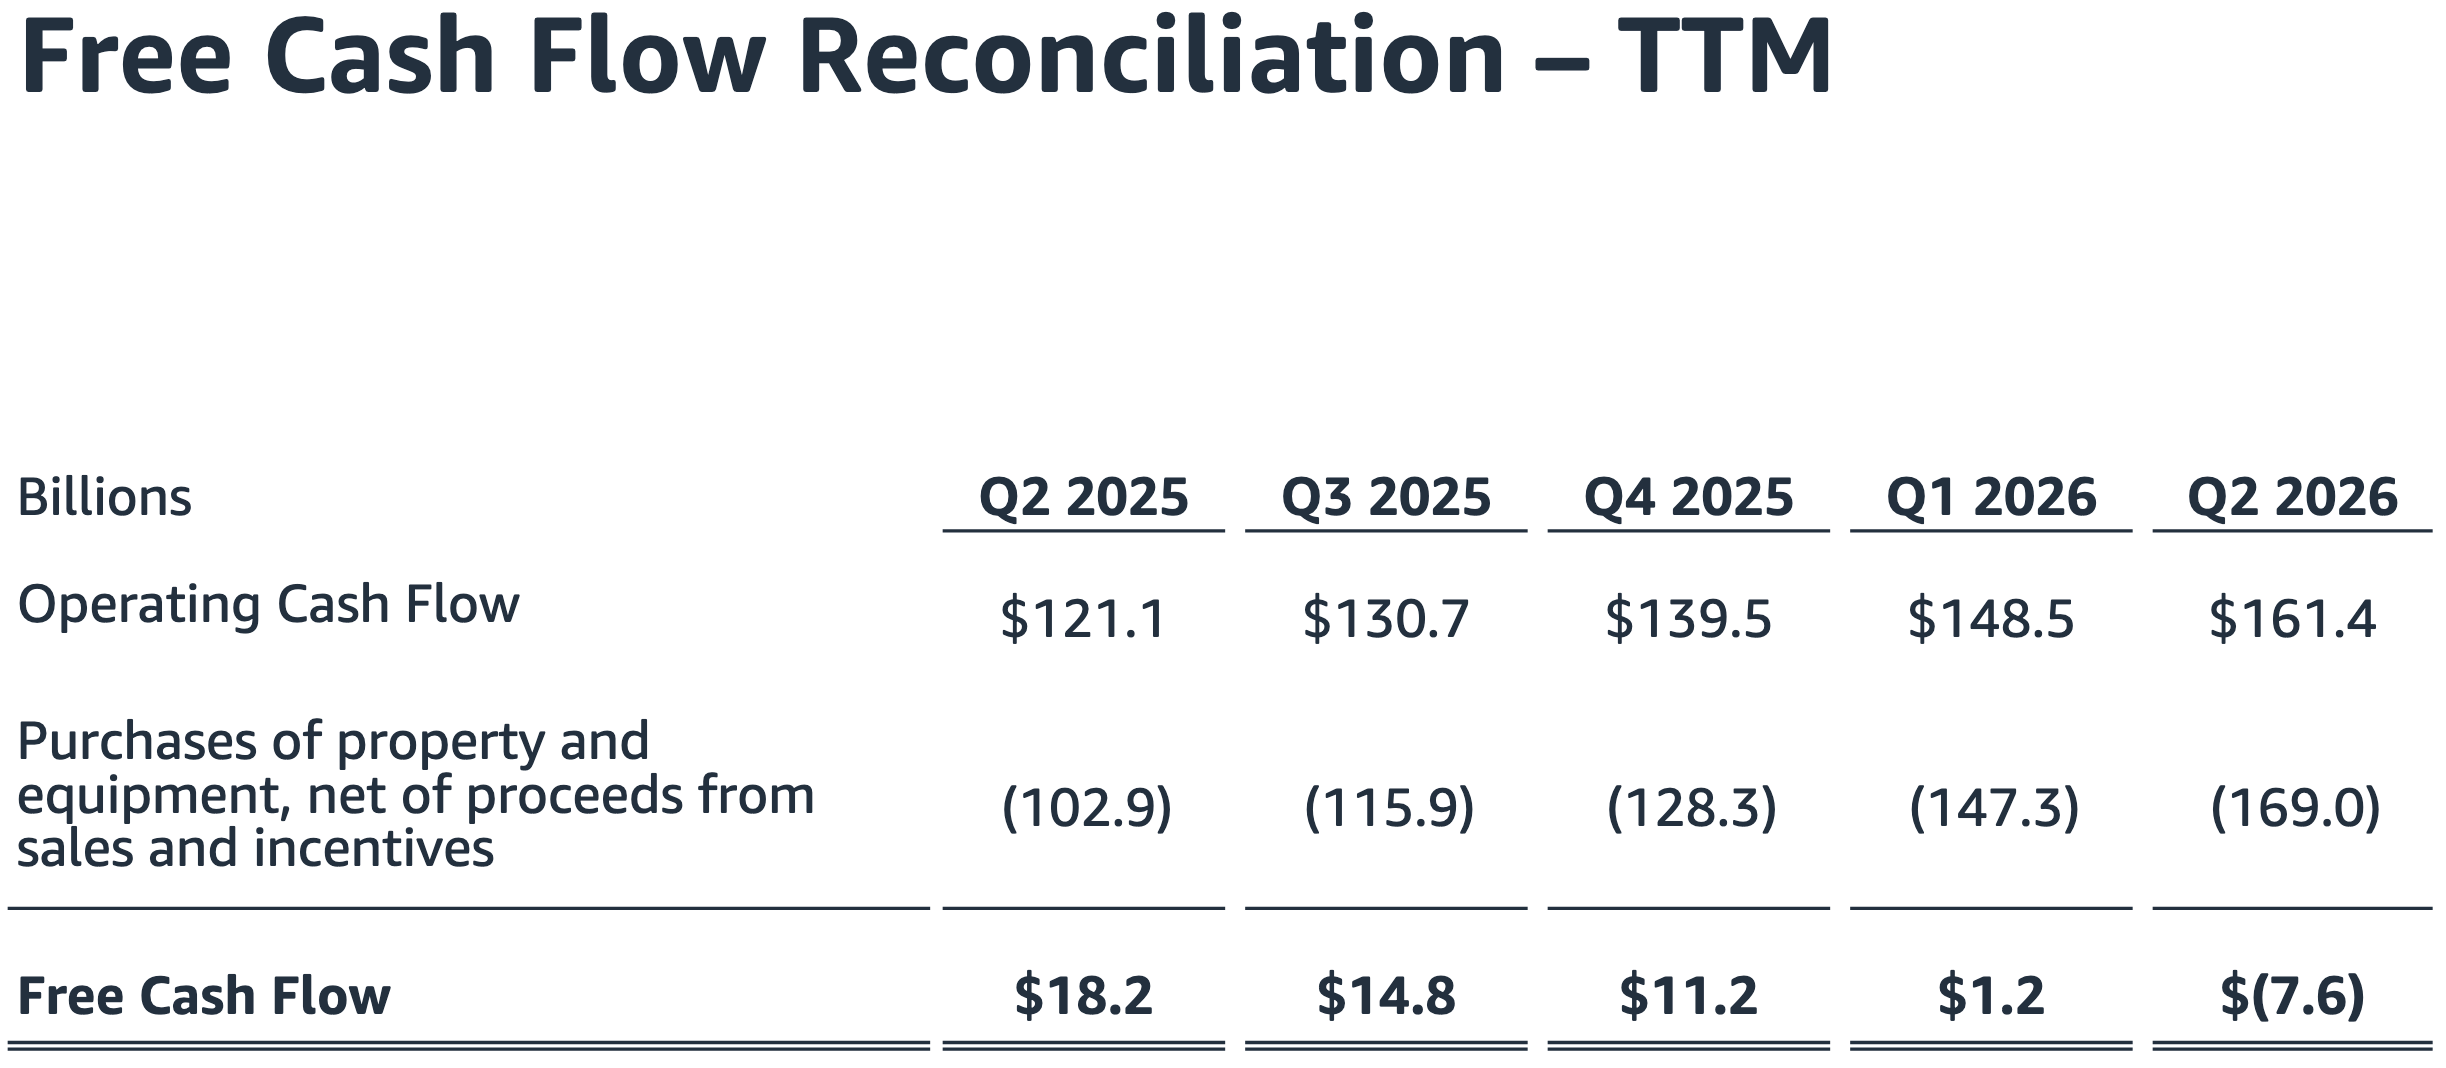
The numerator is intact. OCF grew 33.2% to a record and the OCF margin reached an all-time-high 20.8%. The entire deterioration sits in one line. Net CapEx rose $66.1 billion, which Amazon attributes to “investments in artificial intelligence”. FCF went negative because Amazon spent the cash, not because the business stopped producing it. Amazon ran the same cycle between 2020 and 2022.
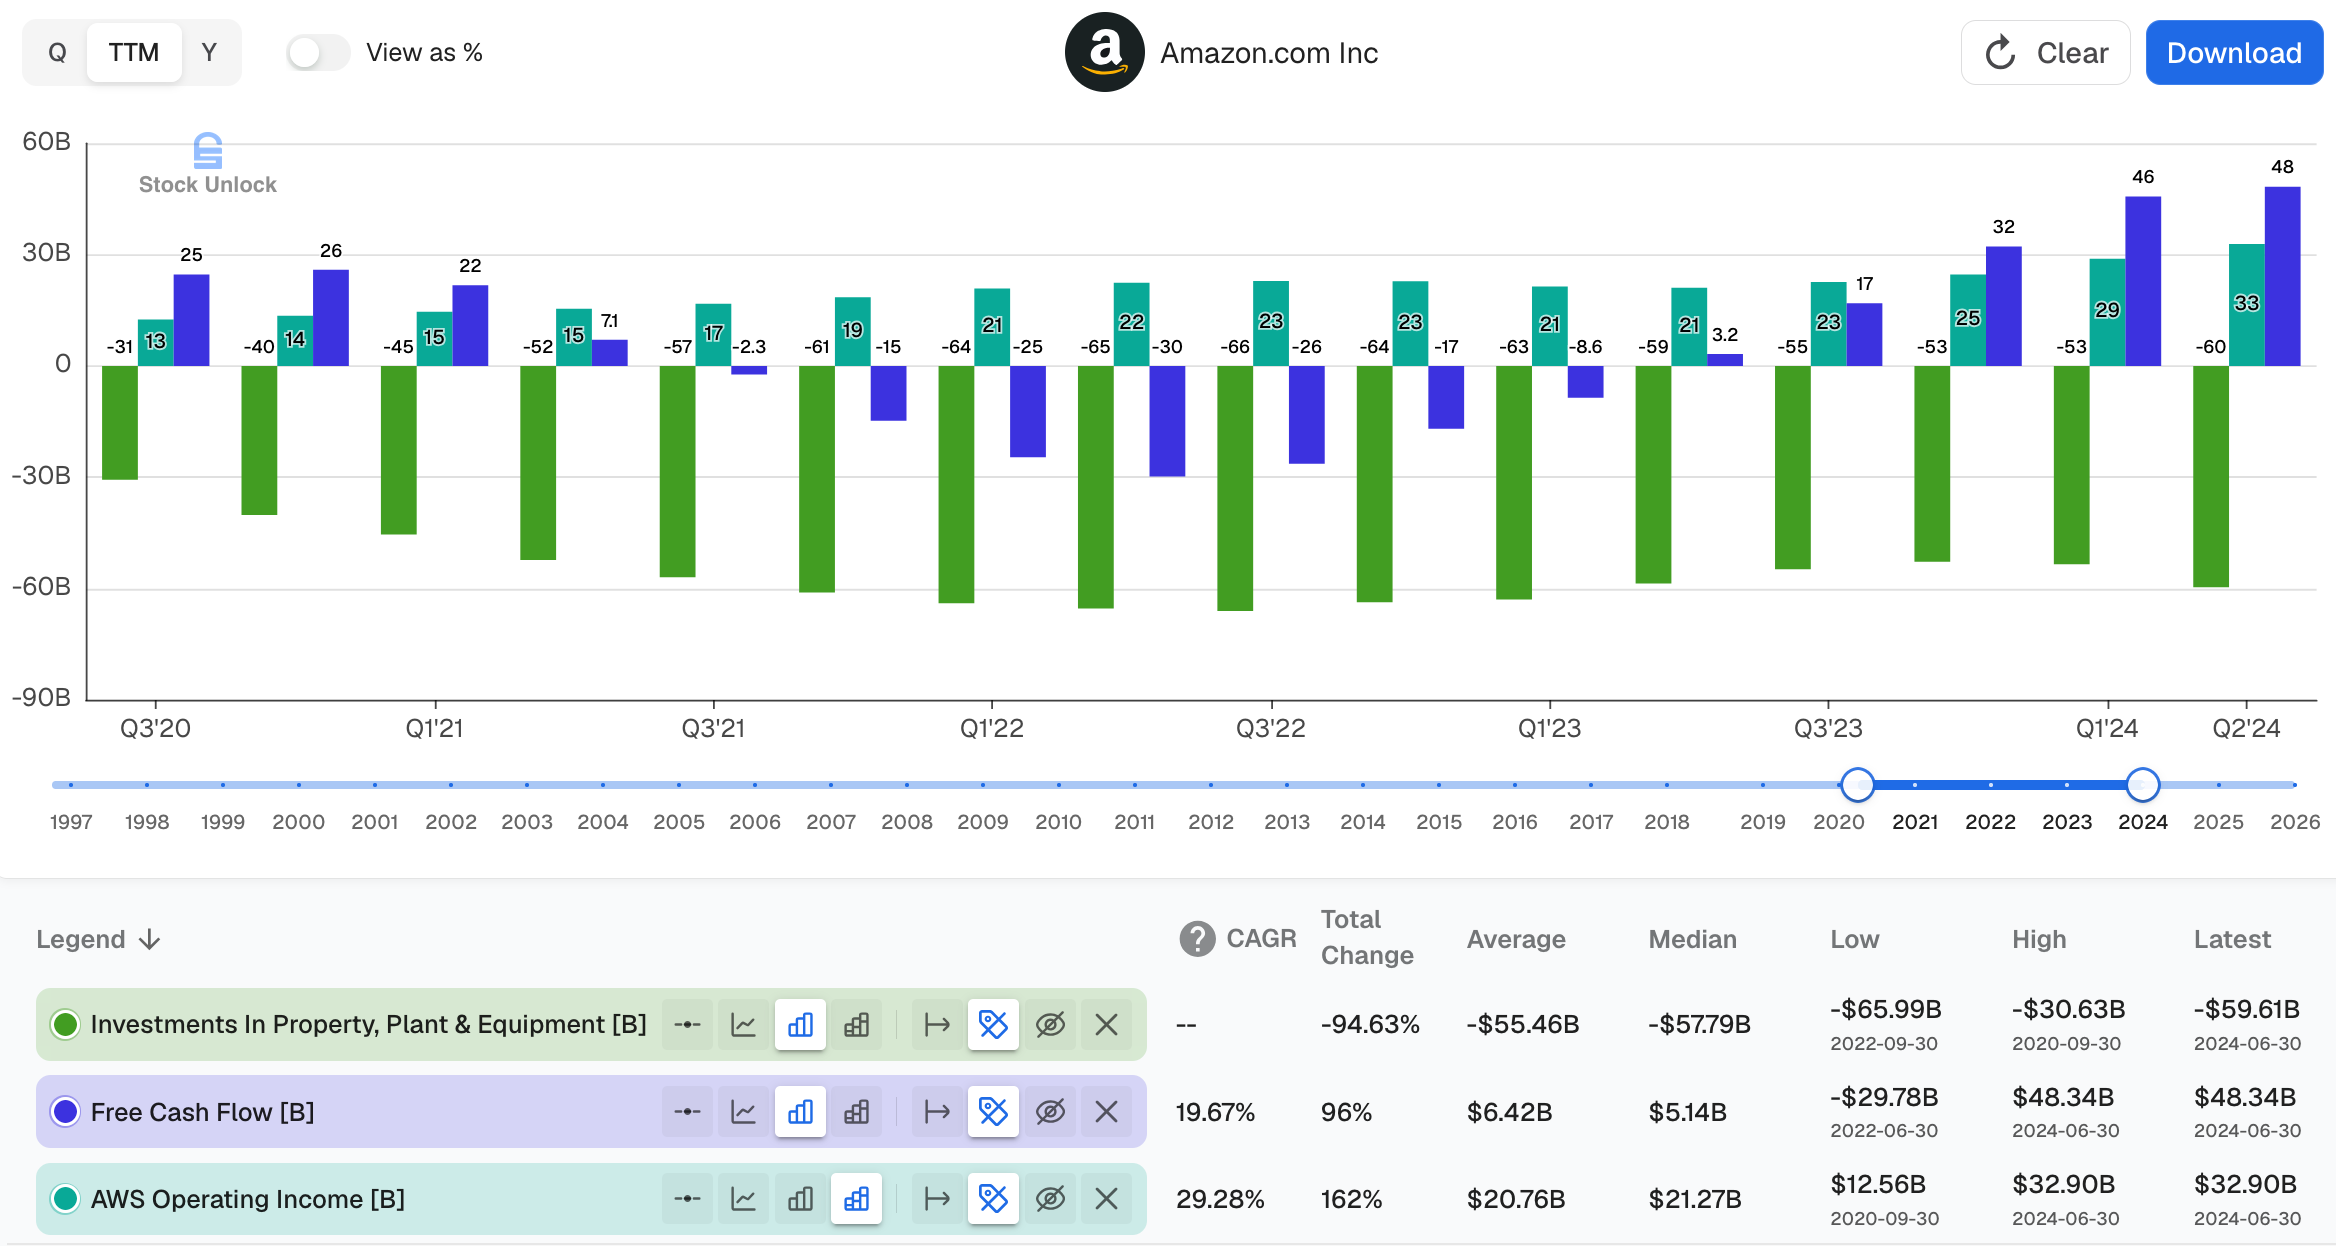
The commentary at the time said Amazon had overbuilt. The assets then came online and FCF swung to $48.3 billion by mid-2024, a $78 billion turn in two years. AWS operating income rose every quarter through the trough, compounding at 29.3%. Cash left the business because Amazon was building assets. Today’s cycle has the same shape on roughly 10 times the capital, with shorter-lived assets.
Debt funded the buildout for the first time
A $220 billion buildout has to be paid for, and Amazon is no longer paying for it out of the business alone.
Long-term debt nearly doubled in six months, from $65.6 billion to $128.9 billion, with $132.1 billion of unsecured senior notes outstanding. Amazon drew $67 billion of proceeds in the first half across four issuances, in US dollars, euros, Swiss francs, and Canadian dollars.
Servicing it stays cheap. Annualizing Q2’s $1.3 billion of accrual interest expense gives $5.2 billion, 3.2% of TTM OCF. Note 4 of the 10-Q discloses $650 billion of total contractual commitments, of which roughly $286 billion sits nowhere on the balance sheet. I follow that thread in a separate article.
The funding cost is immaterial against $161.4 billion of annual OCF, and none of this is unusual for a company building at this rate. The change in character is worth naming. Amazon used to fund growth from the business. This year it borrowed. At today’s stock price multiple debt is the cheaper instrument.
Valuation: operating cash flow is the anchor
I have anchored my Amazon valuation on OCF throughout this CapEx cycle, for the reasons I set out previously. FCF is an output of the CapEx schedule rather than of earning power, and the useful-life debate redistributes earnings between periods without changing the cash the business generates.
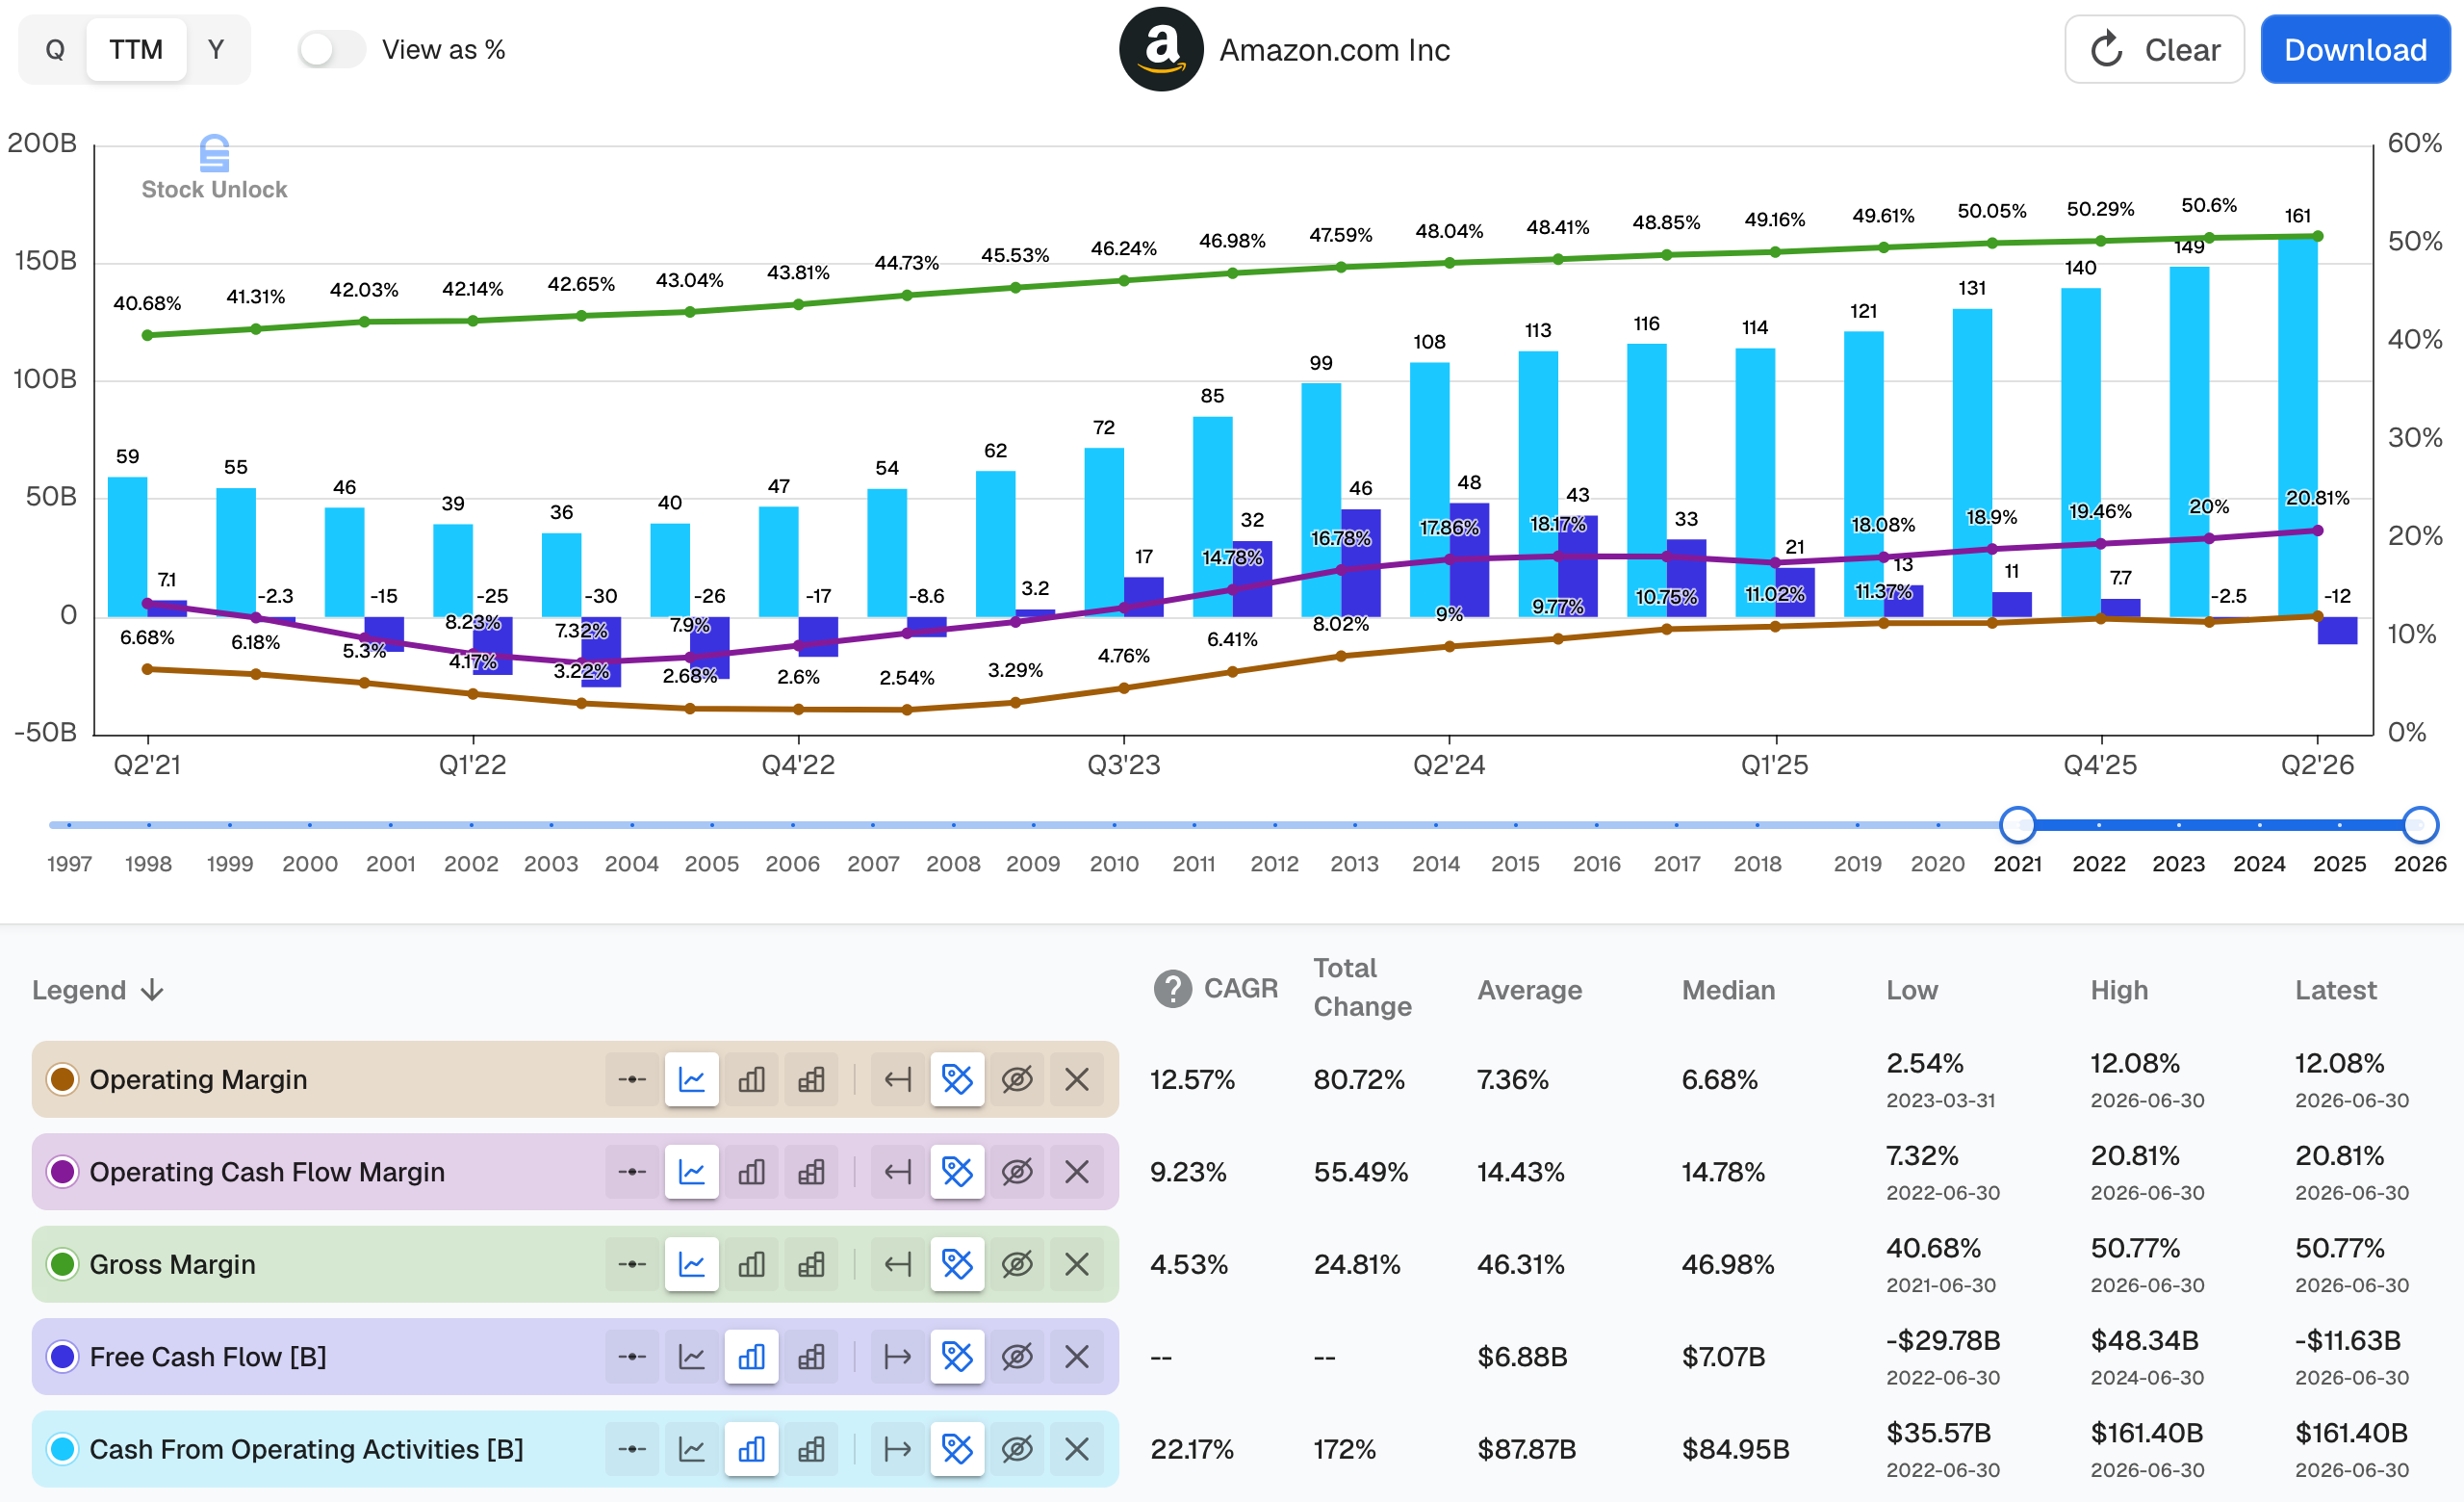
TTM OCF of $161.4 billion on 11 billion shares is about $14.7 of OCF per share. At $259 a share, that is 17.6x TTM OCF. The 10-year median is 25x.
Here is the five-year cash flow sketch, on the assumptions I used in the Q4 2025 earnings article with the base updated:
Grow TTM OCF of $161.4 billion at 20% annually for five years, reaching $401.6 billion. OCF is growing 33.2% TTM and 39.6% in the quarter, so this assumes deceleration from 33.2% to 20%.
Dilute at 1.18% a year from 11 billion shares to about 11.7 billion, giving year-five OCF per share of about $34.40.
Apply a 20x exit multiple, below the 10-year median of 25x, for an implied year-five price of about $689.
Discount at my 10% hurdle for a fair value of about $428 a share against $259 today. That is a 39.5% discount, or an implied 21.8% annual return over five years.
The same exercise produced a fair value of $374.8 in February 2026 after Q1 results. Six months of realized cash flow moved the base and produced the increase. No assumption changed.
A 39.5% discount would normally have me buying. I am holding, because the position is already the size I want.
Final thoughts
One risk is that the buildout never finishes. Every cohort earns its return, reveals more demand, and justifies the next before the previous cohort’s cash reaches shareholders. Warren Buffett explained in his 1992 shareholder letter why that outcome suits an owner:
“Leaving the question of price aside, the best business to own is one that over an extended period can employ large amounts of incremental capital at very high rates of return.”
He added that such businesses are hard to find, because high returns and heavy capital needs rarely coincide. A company deploying $220 billion a year above 20% incremental returns is the business that quote describes. When the runway shortens, conversion returns, as it did after the last buildout. The risk I monitor is that return on spending degrades while the spending continues. Four signposts measure it:
TTM OCF growth falling below 20%: the valuation rests on the cash base compounding. It grew 33.2% this quarter, so the buffer is wide, and this is the number that breaks the arithmetic first.
AWS clean operating margin holding in the mid-30s as depreciation from the 2025 and 2026 cohorts lands.
Backlog composition and conversion speed: I want it drifting toward enterprises, Jassy’s “middle of the barbell”, rather than toward the two AI labs, and converting on schedule. The weighted-average contract life moved from 5.5 to 6.4 years in one quarter, implying the Q2 increment was written at about nine years.
The spread between shipping costs and paid-unit growth: Segment margin reports what already happened. The spread says whether each additional package costs less to move than the last. That mechanism took North America from a 2.1% operating margin in 2022 to 7.9% today.
One signpost turned against me. The shipping spread inverted to -2 points. The other three moved my way. My thesis is unchanged, and this quarter beat my expectations on every part of it that matters.
Remaining performance obligations (RPO), or backlog: contractually committed customer spending, primarily AWS, not yet recognized as revenue. It is a forward revenue commitment, not deferred cash, and it converts as customers consume capacity.
The 6.4 years describes how long Amazon’s customer contracts still run. It is not the depreciation life of any asset. Amazon’s accounting life for a subset of servers and networking equipment is five years, cut from six in January 2025. I covered that reversal in Are AI Chips’ “Useful Lives” Creating Useless Earnings? article. Jassy’s “at least five to six years” is an operational claim.
Internal rate of return (IRR): the discount rate at which all future cash flows, discounted back, equal the amount spent at the start. It is the right measure here because data center capital goes out years before revenue arrives, which a payback period ignores. My 10% hurdle is the minimum annual return I require before funding reinvestment.