
Uber Technologies Inc. (UBER) Q3 2025 Results: The Global Royalty on Movement Shows Its Earnings Power
Why I see Uber as an asset-light, cash-generating “royalty business” on real-world demand, and why today’s price still embeds skepticism

Uber Technologies’ (UBER 0.00%↑) Q3 2025 results on November 4, 2025 (press release) decisively reinforce the thesis that the company is a “royalty company” on global urban mobility and local commerce.
Not royalty in a legal sense, but economically: a structurally advantaged platform that clips a small fee on a rising volume of real-world transactions (rides, food, groceries, retail, on-demand logistics) without owning the underlying physical assets. I borrow this framing from Bill Ackman, who described the ideal business as one that “collects a royalty on the growth of others” in an interview that shaped my thinking about platforms.
Q3 shows this idea playing out in practice. The business is compounding scale and engagement not by pushing price, but by making the platform more useful, more integrated, and more affordable. CEO Dara Khosrowshahi captured this shift in tone and posture in the earnings press release:
“Uber’s growth kicked into high gear in Q3, marking one of the largest trip-volume increases in the company’s history.”
And he made the strategic direction explicit:
“We’re building on that momentum by investing in lifelong customer relationships, leaning into our local commerce strategy, and harnessing the transformative potential of AI and autonomy.”
Underpinning this “royalty” profile is a liquid, defensible marketplace: a broad, global base of earners; dense geographic coverage; and a deeply integrated consumer experience across Mobility and Delivery. Cross-platform users are more loyal and more valuable, yet penetration of multi-product usage is still low enough to leave a long runway. This quarter’s acceleration is not just more usage; it is the network effect compounding: more users, using Uber more often, across more categories, with increasingly high switching costs for both consumers and merchants.
Five Key Takeaways From Q3 2025
The quarter combined powerful top-line momentum with more measured, but still positive, growth in profitability and cash generation.
Scale and Engagement
Total trips reached 3.5 billion (+22% YoY), Gross Bookings $49.7 billion (+21% YoY), and Monthly Active Platform Consumers (MAPCs) 189 million (+17% YoY), with monthly trips per MAPC up 4%. These figures aren’t an anomaly; they sit broadly in line with (or slightly below) Uber’s multi-year compounding: Total trips have grown at 24.3% over the past five years, Gross Bookings at 27.5%, and MAPCs at 19.5% CAGR. In other words, Q3 confirms that the long-term growth engine is intact; driven by real usage and frequency rather than price inflation, with average pricing roughly flat.
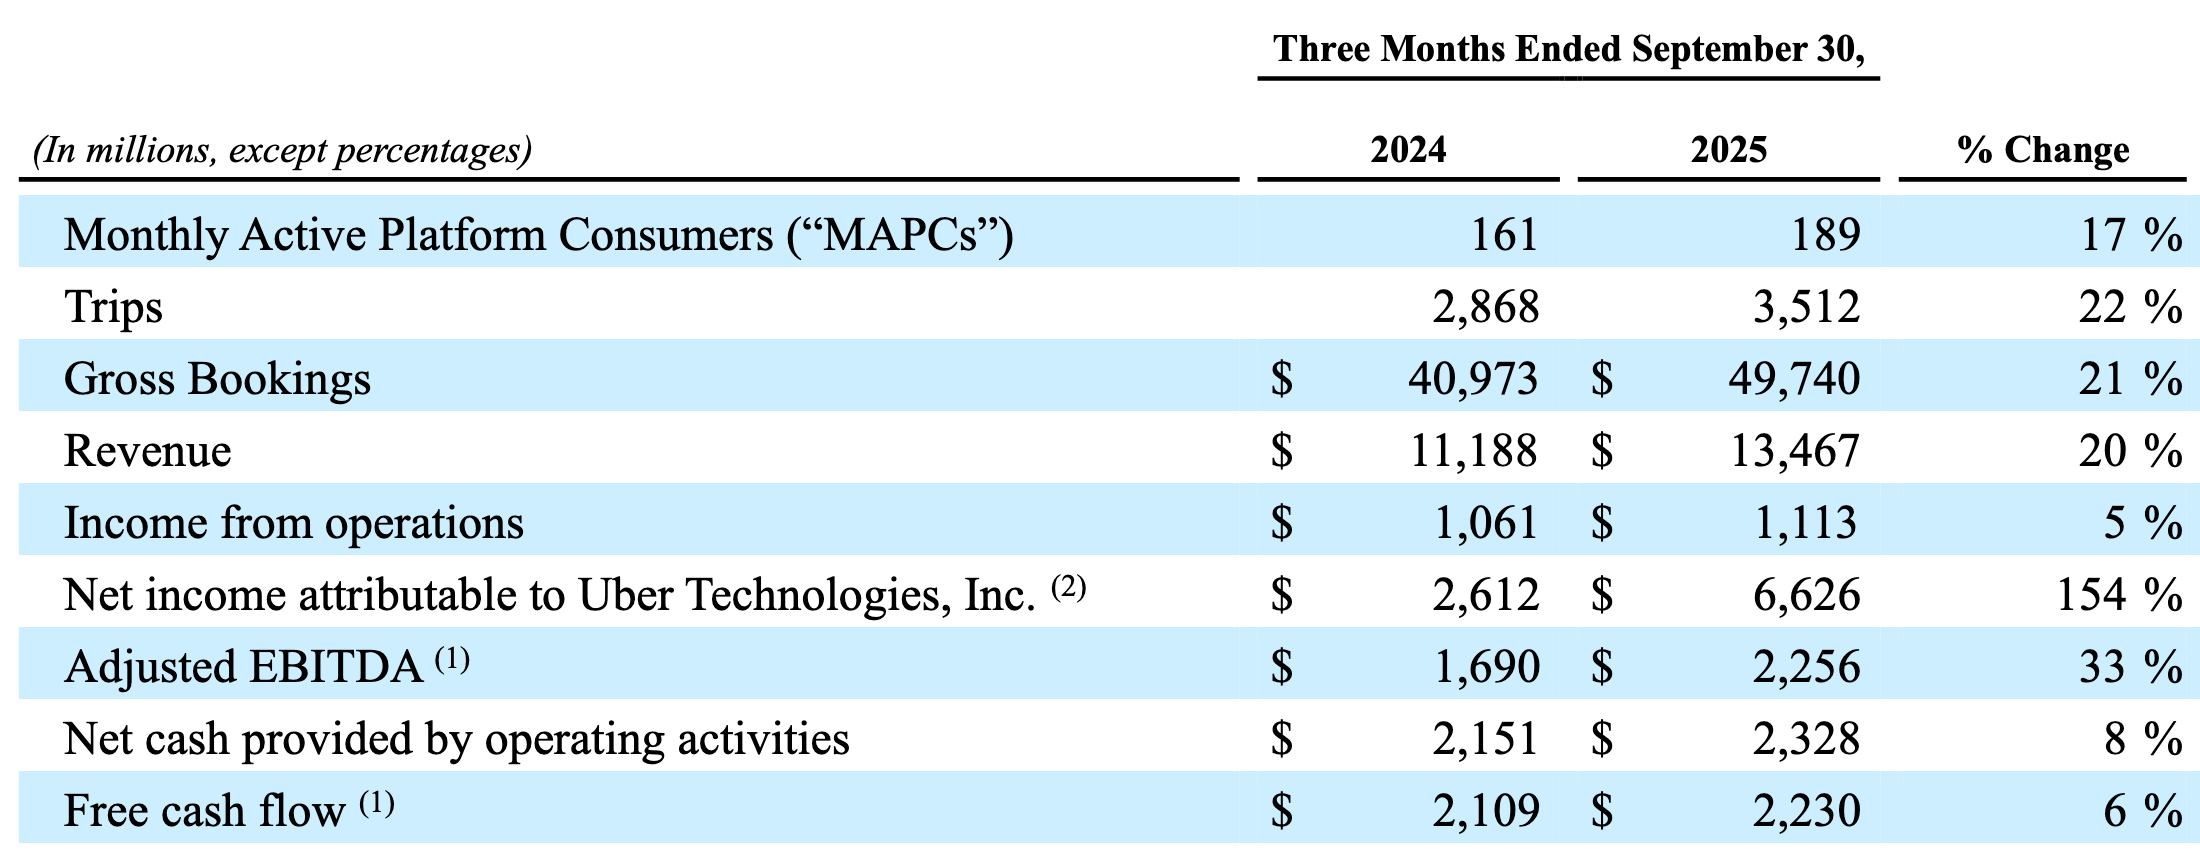
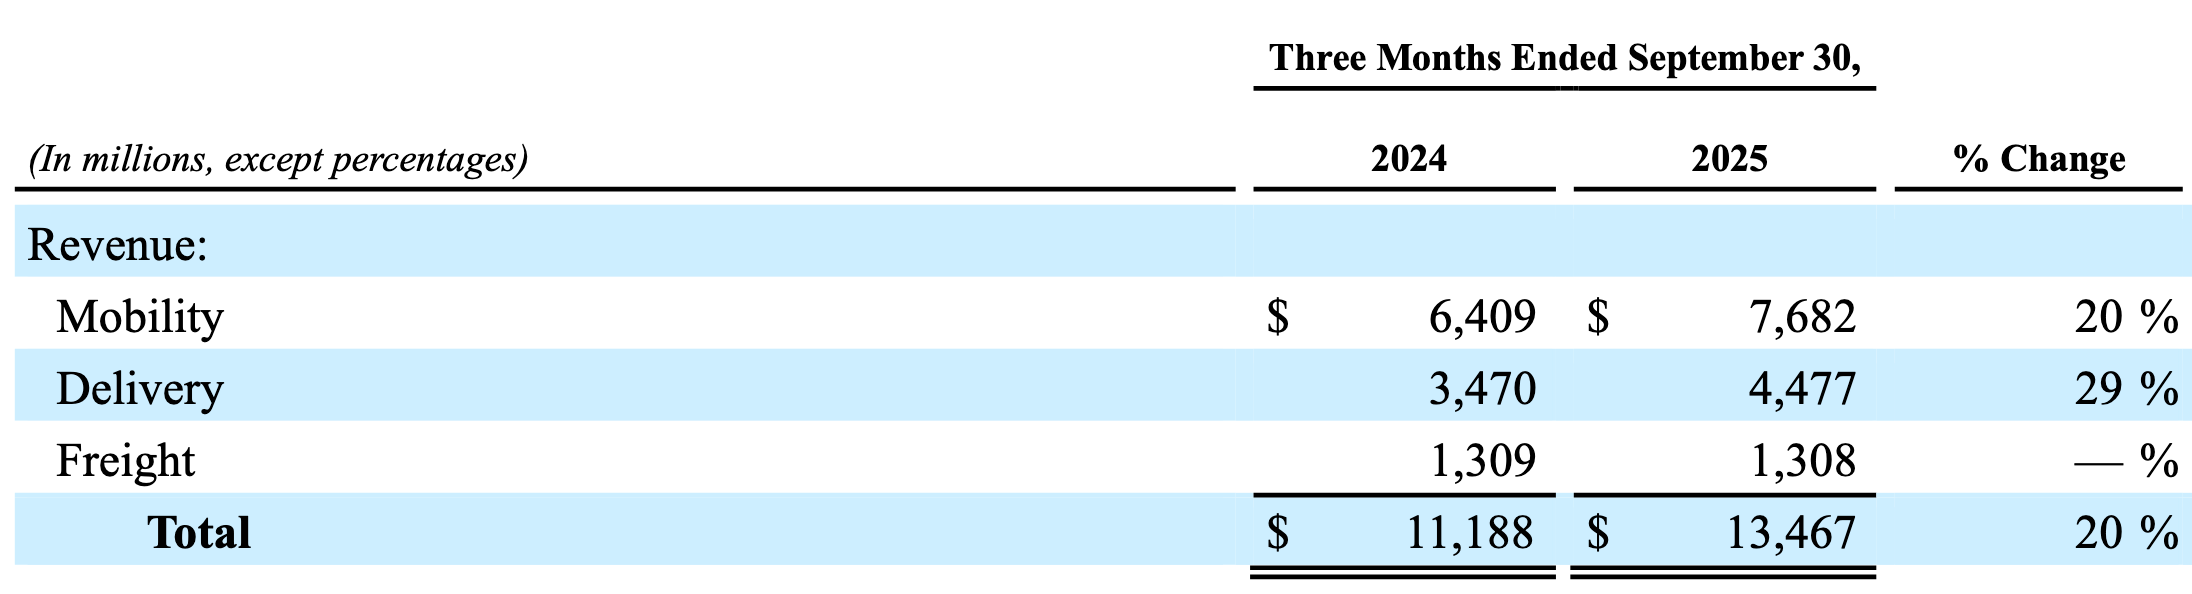
Revenue
Revenue grew to $13.5 billion (+20% YoY), broadly in line with Gross Bookings, reflecting healthy unit economics while the platform scales.
Operating Income
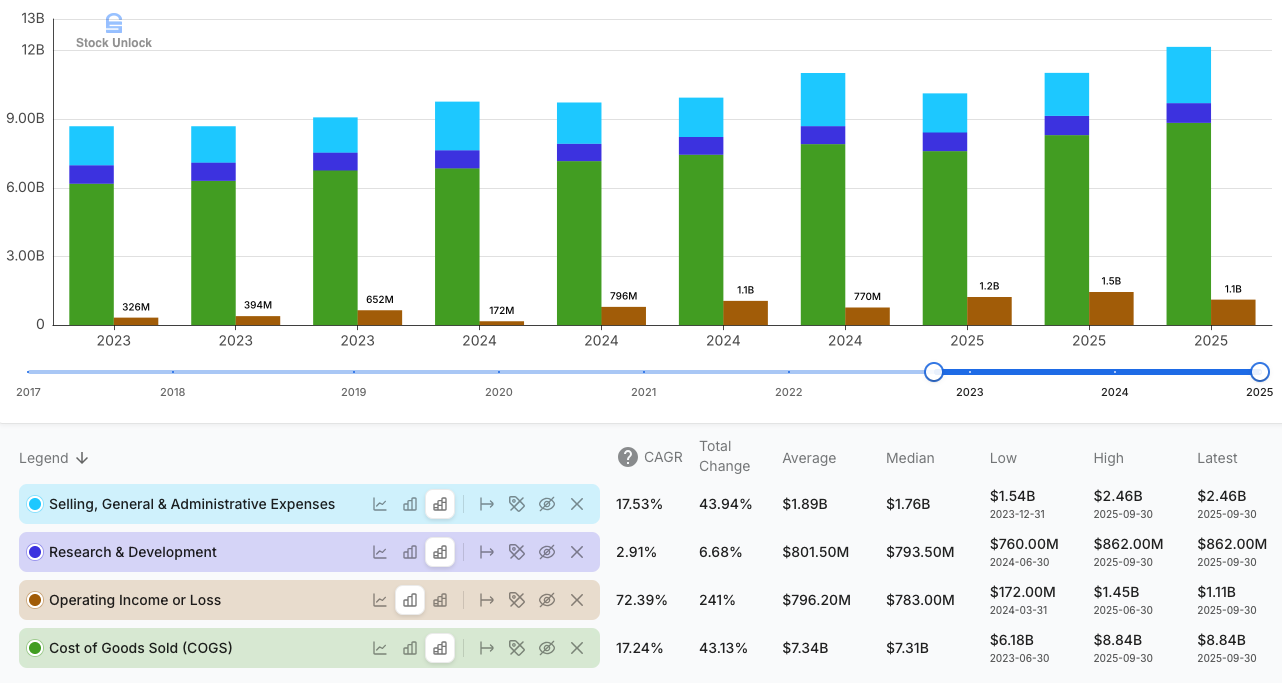
Income from operations (EBIT) increased to $1.1 billion (+4.7% YoY). In isolation that looks like steady, unspectacular growth; in context, it’s strong evidence of operating leverage. Since Uber first turned sustainably profitable at the operating line in mid-2023, operating income has compounded 72.4% yearly from $326 million to over $1 billion per quarter, growing faster than revenue over this period. That progression shows Uber adding incremental Gross Bookings and revenue without a proportional increase in Cost of Goods Sold (COGS) and operating expenses. In other words, a larger share of each new dollar flowing through the platform is dropping to the operating line.
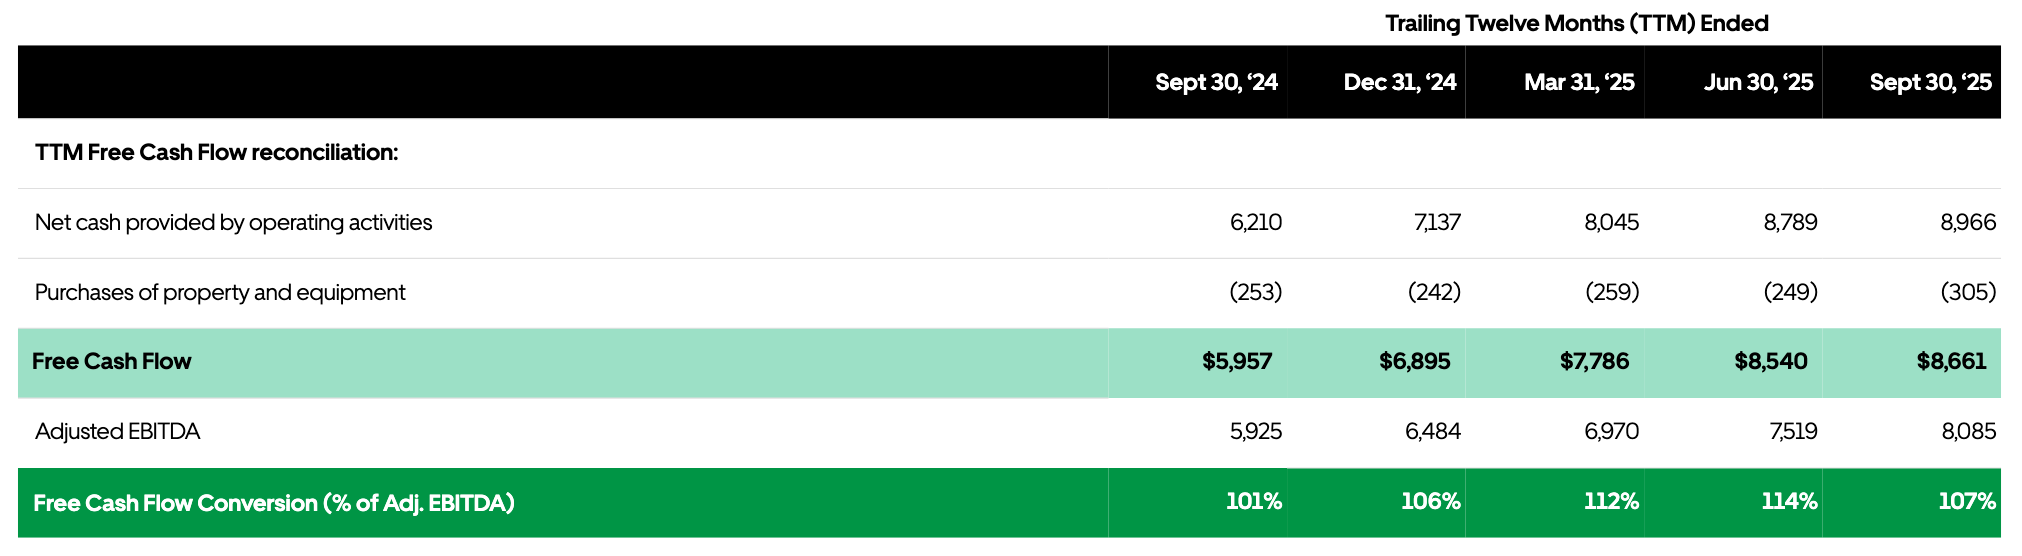
Free Cash Flow
Trailing twelve-month (TTM) FCF reached $8.7 billion (+45.3% YoY). The cash engine remains solid, even if quarterly growth is muted by timing effects and reinvestment.
Network Quality and Cross-Platform Leverage
Uber reported 9.4 million drivers and couriers earning around $22 billion in Q3, reinforcing marketplace depth. Consumers using both Mobility and Delivery spend 3x more and have 35% higher retention, yet only 20% of eligible monthly active users currently use both products; an embedded, high-ROI growth lever. Khosrowshahi’s own summary on the call, “an outstanding quarter” with trips and Gross Bookings growing strongly while pricing stayed flat, aligns with this picture of durable, demand-led growth.
Uber’s Real Profit Story Runs Through FCF
The headline GAAP number, Net Income of $6.6 billion, is eye-catching and, on its own, misleading. As disclosed in the press release and detailed in the 10-Q, this figure is heavily distorted by two non-operational items:
A $4.9 billion benefit from the release of the Netherlands deferred tax assets valuation allowance which should reduce future GAAP tax expense / effective tax rate over time; and
A $1.5 billion net unrealized gain from revaluations of equity investments (notably Aurora, Didi, and Grab).
The tax item is purely non-cash. Uber has concluded it is now “more-likely-than-not” that these deferred tax assets will be realizable, which justifies releasing the allowance. That is an economically positive milestone, but it inflates Q3 Net Income without reflecting incremental cash generation. CFO Prashanth Mahendra-Rajah is transparent about this, in the prepared remarks:
“Net income for the quarter was $6.6 billion, which included a $4.9 billion benefit from a tax valuation release.”
This is one of the reasons why I anchor on Free Cash Flow (FCF) as the measure of earnings power. In Q3, FCF was $2.2 billion, up 5.7% YoY. TTM FCF was $8.7 billion, up from $5.95 billion in the prior-year period, +45.3% YoY. Mahendra-Rajah reinforces how to read it:
“On a trailing twelve month basis, we generated a record $8.7 billion of free cash flow […] As a reminder, FCF conversion can fluctuate on a quarterly basis due to working capital seasonality and the timing of cash payments, and we encourage investors to evaluate our FCF on an annual basis.”
The modest 5.7% FCF YoY growth in Q3 is not a red flag. It reflects normal working capital and payment timing effects, and a deliberate choice to keep investing in growth initiatives (Grocery & Retail, membership, merchant tools, autonomy) instead of maximizing near-term reported profits. On the call, the CFO underlined this philosophy, noting they are “very deliberately moderating the pace of our margin expansion” because they “have so many exciting opportunities to invest in”.
Stripped of one-time accounting noise, the picture is straightforward: Uber is sustainably profitable on a GAAP operating basis and strongly cash generative, with FCF growing healthily over a 12-month lens.
Mobility: The Core Royalty on Urban Movement
The Mobility1 segment is the clearest expression of Uber’s royalty economics.
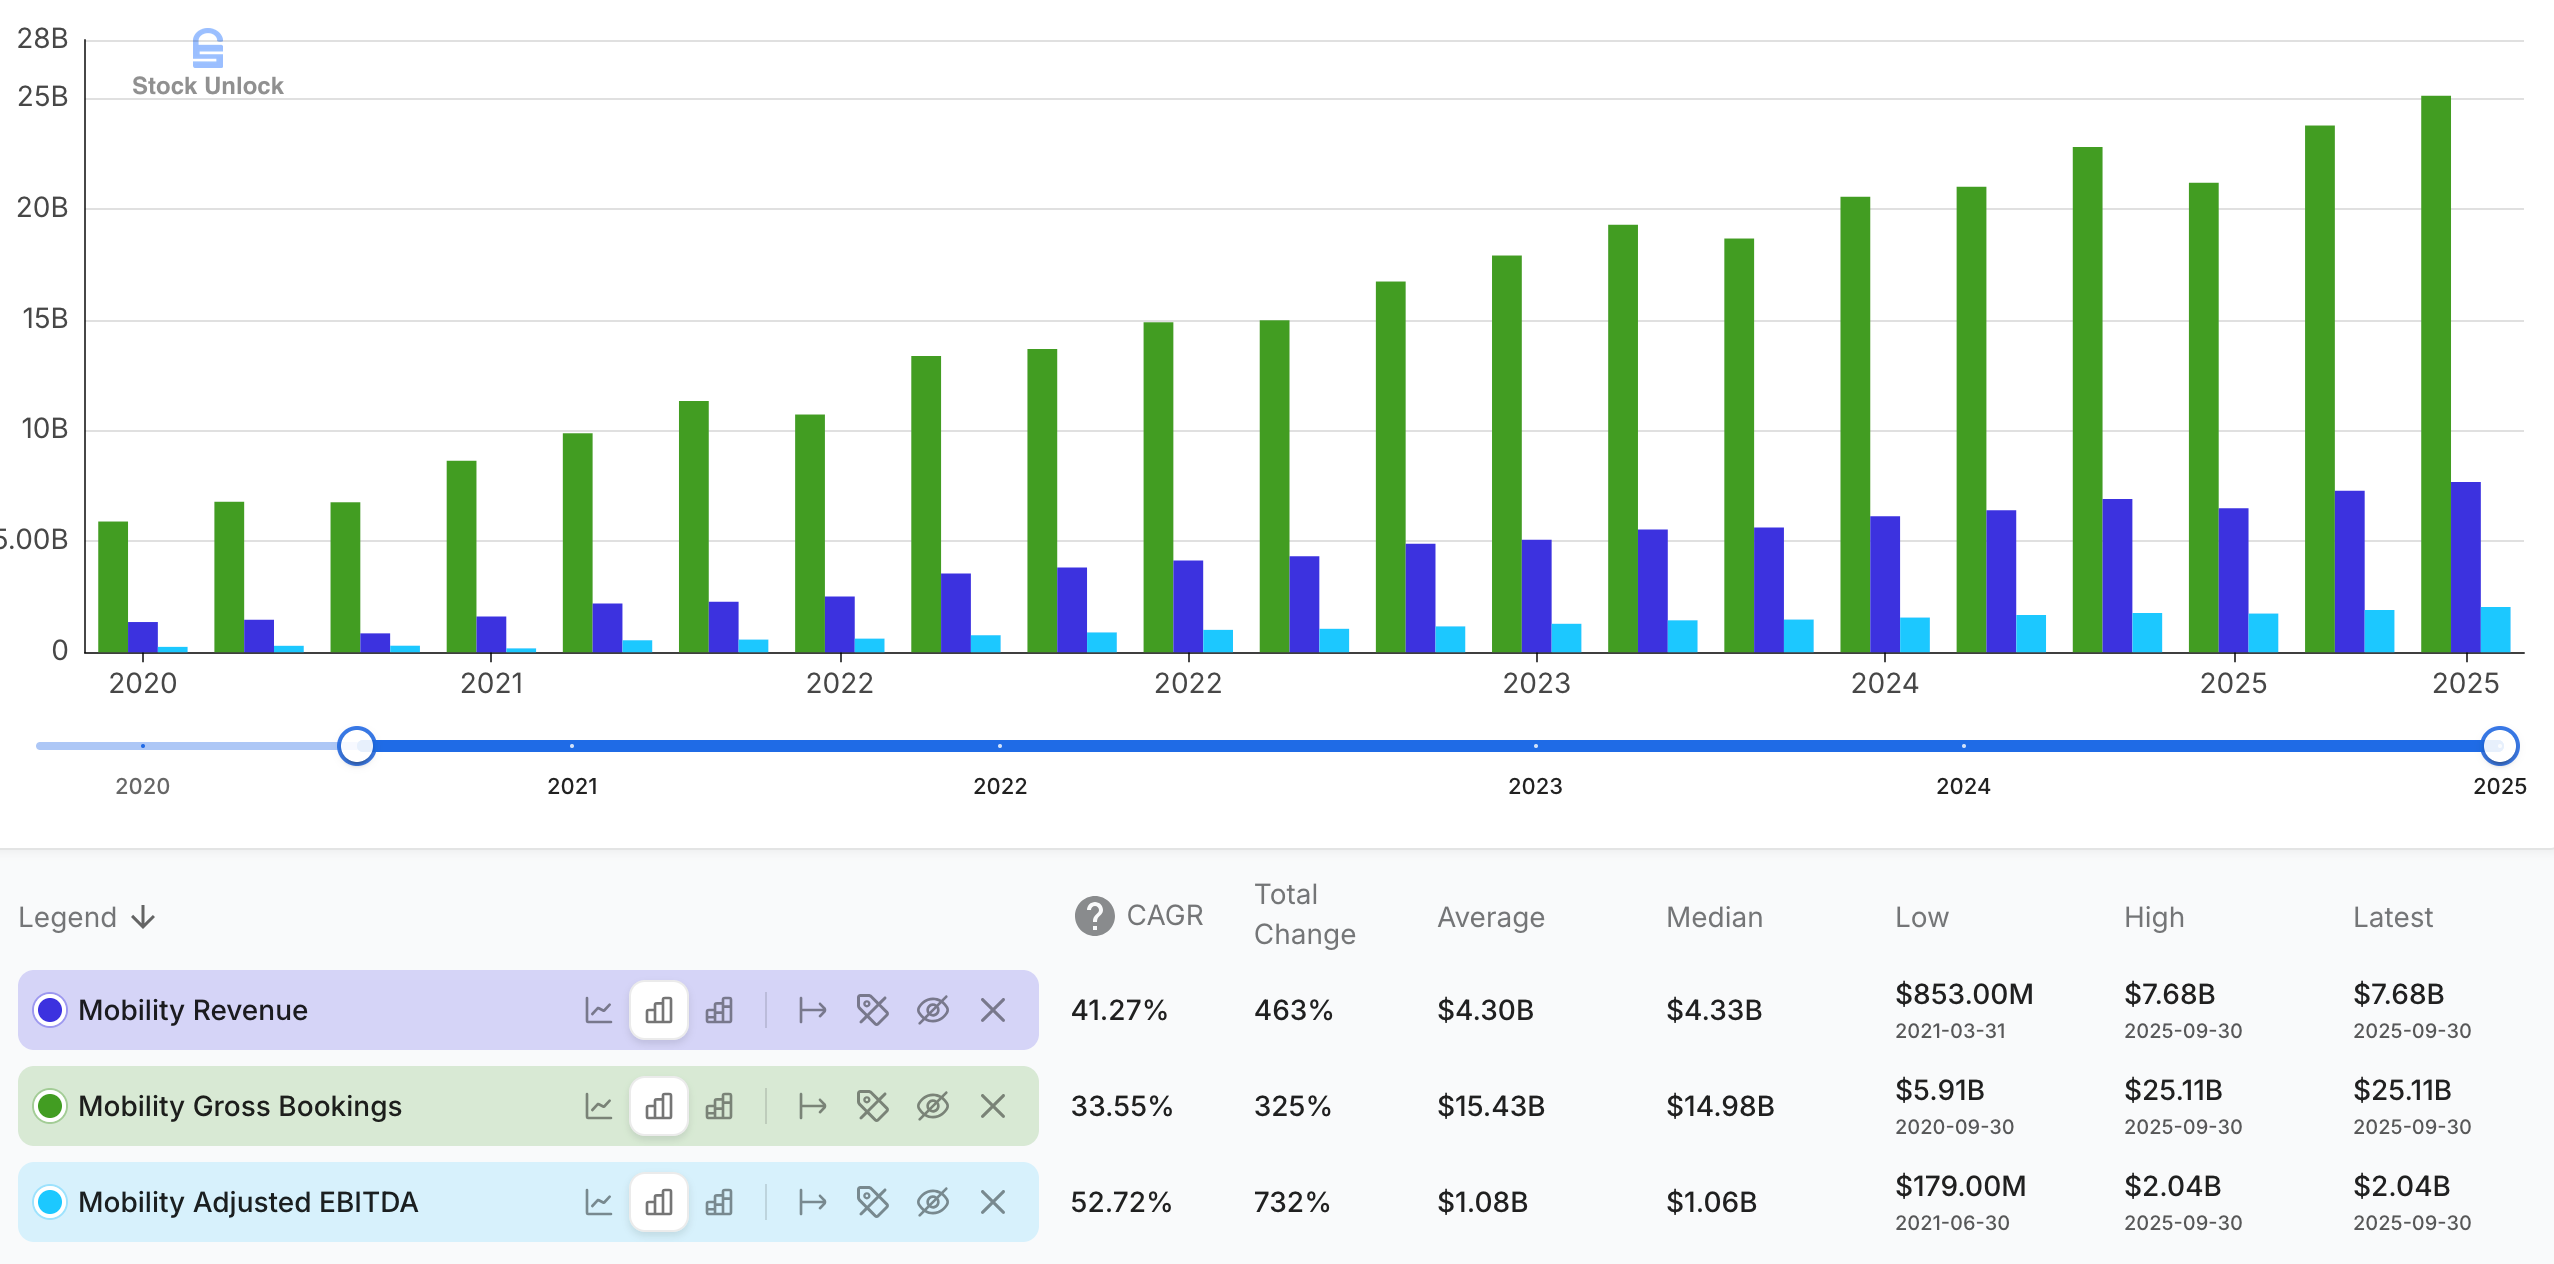
Q3 2025 Mobility Gross Bookings reached $25.1 billion, up 19.6% YoY, while Mobility revenue rose to $7.7 billion, up 19.9% YoY. Mobility trips grew 21%, outpacing already-strong historical run-rates. Looked at over the past five years, the chart makes the story clearer: Mobility Gross Bookings have compounded at mid-30s%, segment revenue at low-40s%, and Mobility adjusted EBITDA2 at more than 50% CAGR annually over that period. As the five-year trend shows, that underlying profitability has expanded dramatically as the network has densified.
Khosrowshahi framed the step-change:
“After three consecutive quarters of 18% trip growth, we delivered 22% trip growth this quarter, driven by 21% Mobility trip growth, well ahead of our expectations.”
Several dynamics underpin this performance. Uber pushed affordability, including lower-cost products and moderating insurance pressures, without sacrificing profitability at the platform level. Average price remained roughly flat (–1% YoY) while trips and Gross Bookings surged. Geographically, growth was broad-based: strong U.S. volume on improved affordability and international strength supported by summer travel, taxi integrations, and formats like Reserve, Moto, and Uber for Business.
Liquidity is a key edge. An expanded and better-utilized driver base shortens wait times and increases reliability, reinforcing user preference and pushing more demand onto the platform. The 9.4 million drivers and roughly $22 billion in payouts in Q3 highlight the depth of that ecosystem.
For investors, Mobility demonstrates that Uber can maintain and extend category leadership while keeping its service affordable and still producing meaningful operating profit and cash flow. It is the anchor royalty stream on urban transportation.
Delivery: From Food to Full-Stack Local Commerce
If Mobility is the original royalty on movement, Delivery3 is the emerging royalty on local commerce.
In Q3 2025, Delivery Gross Bookings grew 25% to $23.3 billion, and Delivery revenue grew 29% to $4.5 billion. The gap between Gross Bookings growth and revenue growth is important: it reflects not only volume, but also better monetization. The five-year trend reinforces this: Delivery Gross Bookings have climbed from $8.6 billion to over $23 billion, while Delivery revenue has nearly quadrupled, compounding at about 31.5% vs. 22.2% for Gross Bookings. That spread, together with the shift from losses to solid positive adjusted EBITDA, is a clear sign of improving take rates and structurally stronger monetization.
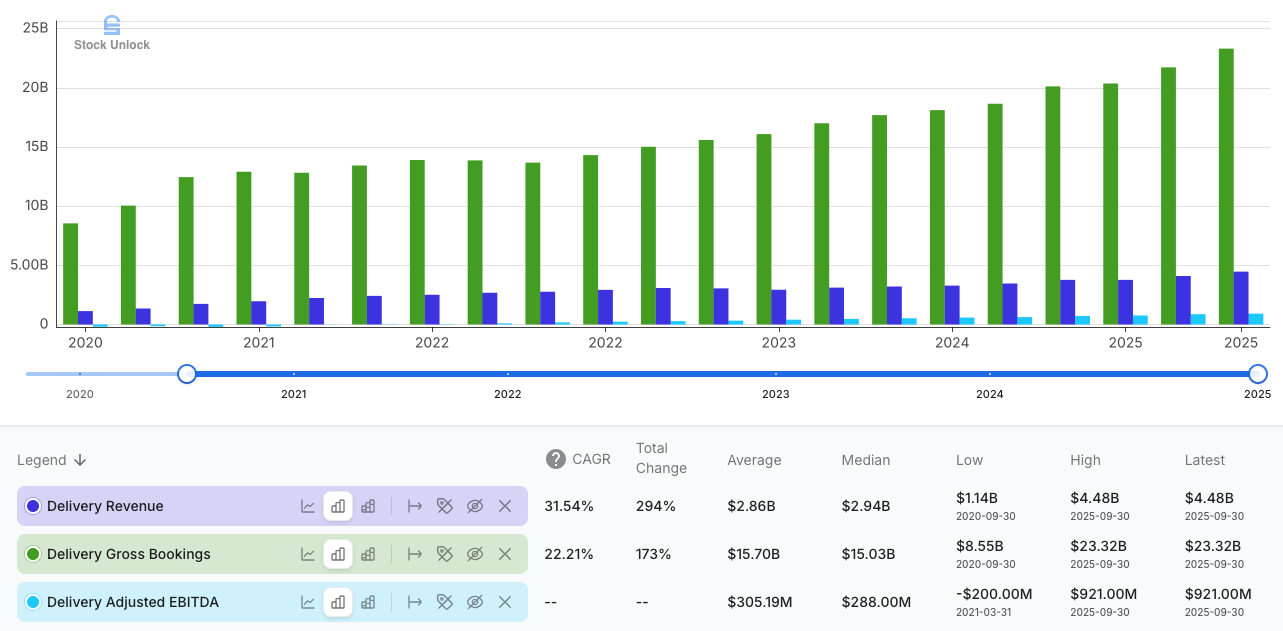
The 29% revenue growth is attributable to the 25% Gross Booking increase plus a $146 million increase in advertising revenue, a high-margin layer on top of the logistics network. This is exactly how a platform royalty should evolve, by earning more per unit of activity without undermining user value.
The strategic centerpiece is Grocery & Retail (G&R). Management highlights that G&R is “an approximately $12 billion Gross Bookings run rate and growing significantly faster than restaurant delivery”. Q3 2025 results show that G&R drives customer acquisition: about 7% of Delivery first-time users come through G&R and platform frequency increases by 27% after users adopt G&R.
Meanwhile, Uber is becoming a growth engine for merchants: Over 1.2 million merchants use Uber, and ads plus merchant-funded offers are scaling quickly, with spend “up over 50%” and driving incremental sales.
This is Delivery maturing from a food-delivery marketplace into infrastructure for anything local - a second, diversified royalty stream on commerce, reinforced by data, membership (Uber One), product innovation (Meal Deals, quality improvements), and partnerships.
Freight: Cyclical, Contained, and Non-Core
The Freight4 segment remains the most challenged piece of the business, reflecting the broader freight downcycle rather than a structural break in Uber’s model. In Q3 2025, Freight Gross Bookings and revenue were $1.3 billion, flat YoY. Management attributes this to a “challenging freight market cycle”, with lower revenue per load offsetting volume, keeping Freight Gross Bookings “relatively flat”.
Segment losses accounted for a modest -$20 million in the quarter. Two points matter: First, Freight is not consuming disproportionate capital or management bandwidth relative to the scale of Mobility and Delivery. Second, if and when the freight cycle turns, Uber has the infrastructure to benefit without rebuilding from scratch.
For now, Freight is best treated as neutral-to-modest optionality, a “call option” on a cyclical recovery, not a pillar of the thesis.
Capital Allocation & Balance Sheet: Quietly De-Risking While Buying Back Stock
Uber exits Q3 2025 with a balance sheet that is strong, liquid, and getting cleaner. The company holds about $9.1 billion in unrestricted cash, cash equivalents, and short-term investments, plus roughly $10.3 billion in equity stakes, against $11.8 billion of debt that is largely long-dated, fixed-rate Senior Notes. YTD, Uber has monetized approximately $1.4 billion of those equity stakes and is recycling the proceeds into growth and balance sheet optimization, not plugging holes.
In Q3, Uber issued $2.3 billion of new Senior Notes and used them to retire higher-coupon 2027 and 2028 notes and position itself to pay down the $1.2 billion Convertible Notes due December 2025; extending average maturities by over a year while keeping its weighted average cost of debt roughly flat, as management highlighted in the prepared remarks. Alongside this, Uber repurchased about $1.5 billion of stock in Q3 (roughly $4.6 billion YTD) and authorized an additional $20 billion buyback program, all funded out of robust cash flow. The stated hierarchy is clear and credible: reinvest in high-return initiatives, maintain ample liquidity and an investment-grade profile, and return genuinely excess cash to shareholders.
Looking Ahead: Scaling the Royalty Machine
Looking ahead, management’s commentary and guidance are consistent with the royalty narrative and the financial results: sustain high-quality growth, keep generating cash, and reinvest where the platform’s advantages compound.
On the medium term, management reiterates the framework first outlined during the Investor Update in February 2024 and echoed on the call: mid-to-high teens Gross Bookings growth over a multi-year period, while maintaining strong profitability and cash generation. Mahendra-Rajah stated:
“We see a path to deliver a Gross Bookings CAGR of mid-to-high teens over the next three years. Using the power of the platform and the benefits of scale, we are committed to growing profits faster than the top line, targeting adjusted EBITDA growth at more than 2 times Gross Bookings growth.”
The strategic levers for the next years are clear in Khosrowshahi’s remarks:
Deepen trip → lifetime experience: push cross-platform engagement well beyond the current 20% of monthly active users using both Mobility and Delivery.
Scale Grocery & Retail and “get anything nearby” into a much larger local commerce royalty stream of the $10+ trillion addressable market.
Growth engine for merchants by expanding tools, integrations, and ads so restaurants and retailers rely on Uber for both demand and logistics.
Build a hybrid human-autonomous marketplace, with Uber expecting to be live with autonomous vehicle deployments “in at least 10 cities by the end of 2026”, supported by its expanded NVIDIA partnership and marketplace data.
GenAI everywhere. Use AI to price, match, route, and support more intelligently, lifting efficiency and experience without heavy incremental cost.
Valuation: Paying a Modest Multiple for a Growing Business
When I first wrote about Uber, my thesis was simple: once the business proved it could consistently generate free cash flow, the market would have to re-rate it from “story stock” to “cash machine”. The last two years have validated the first half of that view; the re-rating, in my opinion, is incomplete.
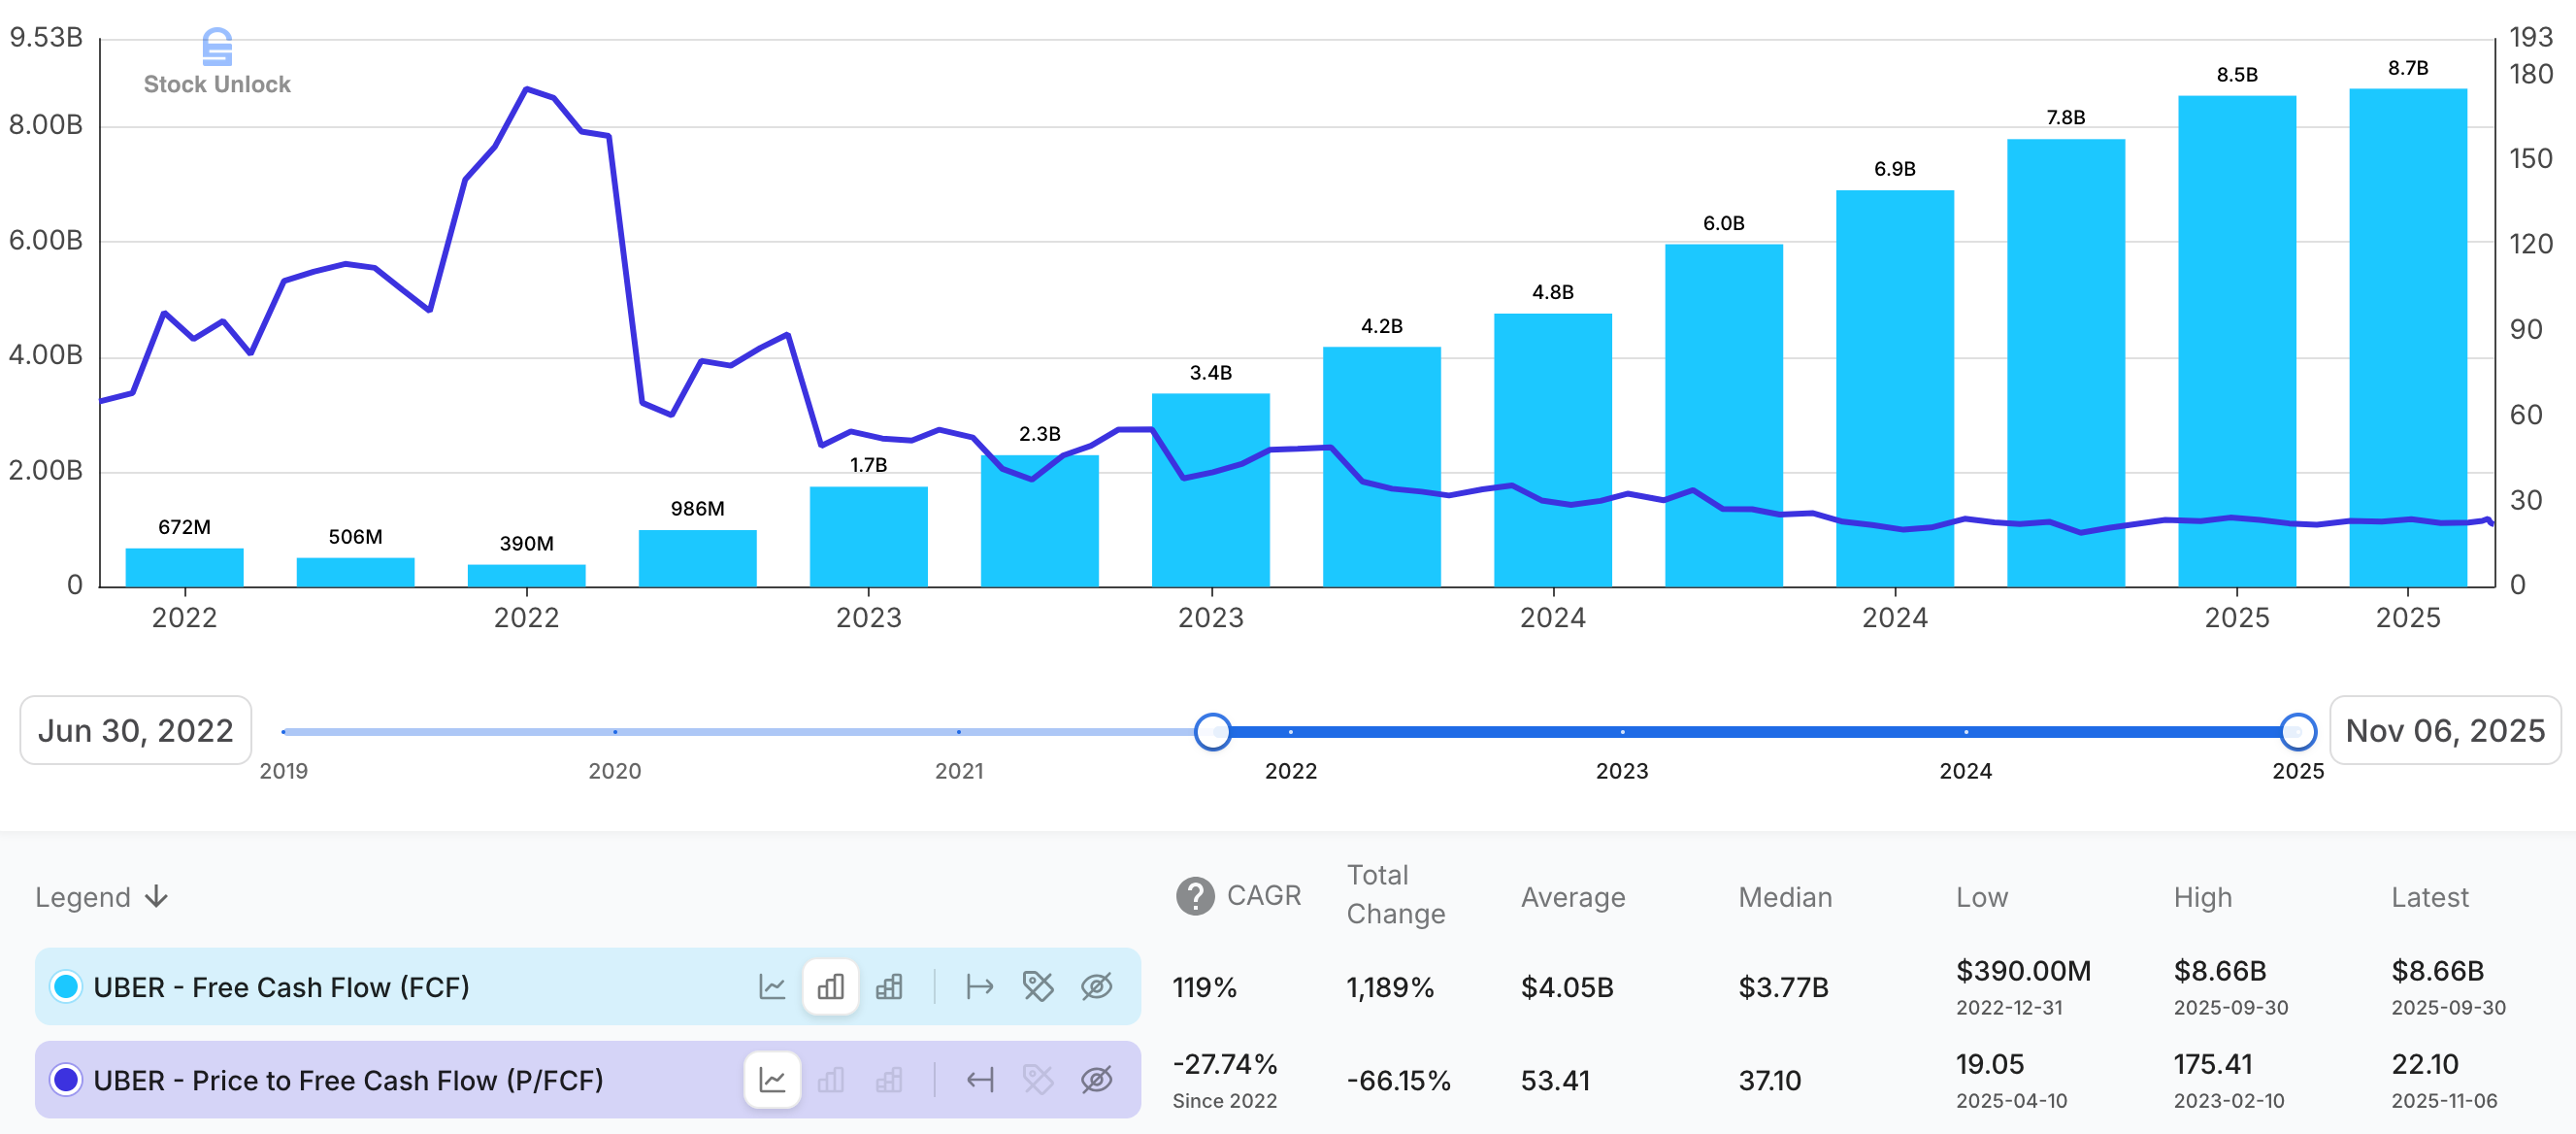
The free cash flow chart tells the story. Since mid-2022, TTM FCF has climbed from $672 million to $8.7 billion (119% CAGR), while the P/FCF multiple has compressed, not expanded. In other words, cash generation is up many-fold; the price investors are willing to pay for each dollar of that cash is lower than it was when the business was riskier and unproven.
On today’s numbers, the market is effectively valuing Uber at 22x TTM FCF. For an asset-light, scaled, global platform that is guiding to growing Gross Bookings in mid-to-high teens, already produces multi-billion dollar annual FCF, has visible reinvestment runways in G&R, merchant solutions, ads and autonomy, and operates with structural advantages in liquidity, coverage, data and cross-platform engagement, that multiple looks conservative. A low-teens P/FCF would imply deep skepticism that this royalty on movement and local commerce is durable; a low-20s multiple assumes it is, but barely credits the length or quality of the runway.
To frame it numerically (directionally, not precisely), I start with $8.66 billion of TTM FCF. Management guides to a “mid-to-high teens” Gross Bookings CAGR and is “targeting adjusted EBITDA growth at more than 2x Gross Bookings growth”, which implies roughly 30-40% growth in their profitability proxy. If Uber were to sustain its current 100%+ FCF conversion on adjusted EBITDA, that framework could support ~32-43% FCF CAGR.
I view that as possible, but optimistic. For my base case, I haircut this to a conservative 20% FCF CAGR over five years - my 20% FCF CAGR assumption sits below management’s framework of profits growing >2x Gross Bookings, leaving room for execution slippage. I assume diluted shares outstanding grow a modest ~1% over the same period (conservative, given buyback programs), and I hold the exit multiple at 22x P/FCF, roughly where the market has traded recently. On those inputs, year-5 FCF is $21.55 billion; at 22x P/FCF and on the projected share count, that implies a future share price a bit above $210. Discounted back at 10%, I get a current intrinsic value of $131 per share, which, against a current price of around $92, suggests Uber is trading at ~40% below my estimate of fair value. On these conservative assumptions, that gap implies the stock could compound at ~18% CAGR from today’s price, comfortably above my 10% hurdle rate.
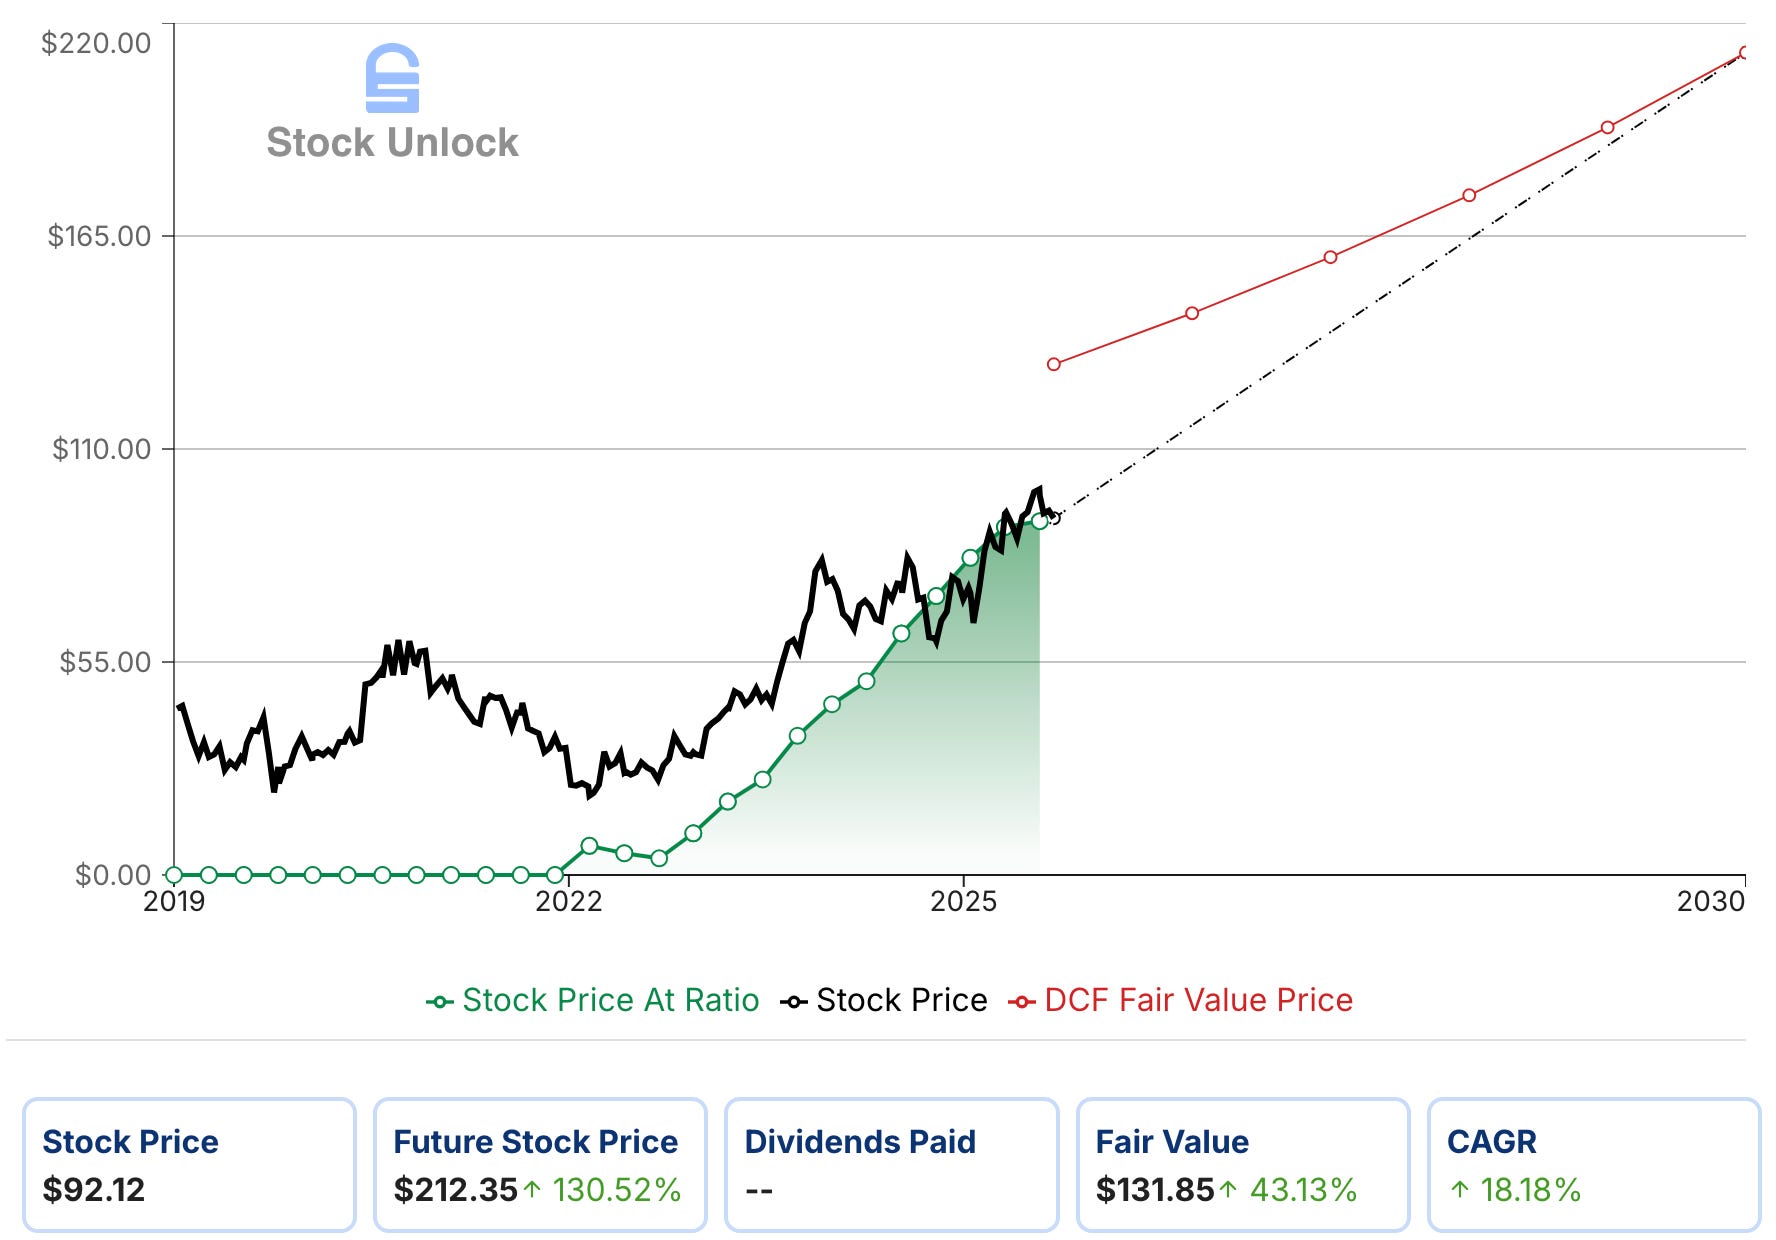
This is not a precise price target, but a sanity check: under reasonable, deliberately conservative assumptions, today’s valuation leaves meaningful upside if Uber executes on its stated plan - compounding Gross Bookings, increasing cross-platform selling opportunities, and scaling profits faster than revenue.
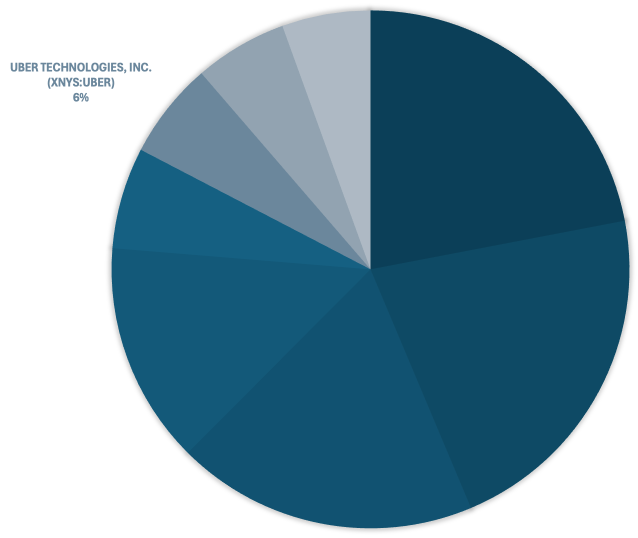
In line with that view, I’ve been building my position in Uber since late May 2025, using a mix of new monthly contributions (dollar-cost averaging) and capital recycled from a lower-conviction holding I exited at a 27% profit in 14 months. Today, Uber sits at approximately 6% of my portfolio, with a path to build it toward ~10% over time to reflect my conviction in the business, its growth runway, and the current undervaluation, while still respecting the residual risks.
Final Thoughts
Uber is no longer a “someday story”; Q3 2025 confirms it’s already operating as a cash-generating, scaled infrastructure platform on top of real-world demand. The GAAP headline is noisy, but the underlying picture is clean: entrenched Mobility, a rapidly evolving Delivery business pushing into local commerce, clear operating leverage, disciplined reinvestment, and billions in free cash flow to show for it. On my conservative assumptions, 20% FCF CAGR, modest share creep, a 22x P/FCF exit, the stock screens roughly 40% undervalued, implying around 18% annualised returns from here, comfortably above my hurdle rate without needing heroic AV or blue-sky scenarios. Risks around regulation, competition, and execution are real, but at today’s price I believe I’m being more than fairly compensated to underwrite them. For me, Uber now sits where I want my capital: in a growing global royalty on movement and local commerce.
Mobility products connect consumers with Drivers who provide rides in a variety of vehicles, such as cars, auto rickshaws, motorbikes, minibuses, or taxis. Mobility also includes activity related to our financial partnerships products and advertising.
Uber defines adjusted EBITDA as net income (loss) from continuing operations excluding income tax, net interest expense, depreciation and amortization, and a series of non-cash or non-core items such as stock-based compensation, certain legal and regulatory reserves, asset impairments, and restructuring or transaction-related costs. It’s management’s way of isolating the underlying earnings power before accounting noise and non-cash charges.
Delivery offerings allow consumers to search for and discover local restaurants, order a meal, and either pick-up at the restaurant or have the meal delivered. In certain markets, Delivery provides offerings for grocery, alcohol, and convenience store delivery as well as select other goods. Uber refers to the grocery, alcohol, convenience and retail categories collectively as Grocery & Retail. Delivery also includes advertising.
Freight connects Carriers with Shippers on Uber’s platform, and gives Carriers upfront, transparent pricing and the ability to book a shipment. Freight also includes transportation management and other logistics services offerings.
Now deduct SBC and insurance reserve and do the multiple. Its now cheaper at 70. Was definitely not that cheap at 90+
Your framing of Uber as a 'royalty company' is a brilliant observation that clarifies so much. Do you foresee this 'royalty on growth' paradigm extending to other, less obvious sectors?