
The Demographics of Slack and Saving
A life-stage map of housing burden, fixed obligations, and who actually has margin to save
This article answers a simple question: who actually has slack (income left after fixed costs) to protect? The same “spend less” advice lands differently depending on age, housing burden, and fixed obligations. I map how slack changes across life stages - rent-squeezed young adults, obligation-heavy midlife, asset-backed retirees, and high earners who still feel cash-flow fragile. The point isn’t to judge cohorts; it’s to show where lifestyle creep is even possible, and where the constraint is mostly arithmetic. If the Lifestyle Inflation Trap explained the mechanism (upgrades → fixed bills → slack shrinks), this article shows who gets hit hardest, and why.

I focus on Italy, the UK, and the US because they reflect different mixes of wages, housing costs, safety nets, and consumer credit - and I’ve lived in two and invested primarily in the third. Terms are defined in the Lifestyle Inflation Trap; here I use them without repeating the definitions.
Young Adults: Gen Z and Millennials, the “Soft-Saving”, Rent-Squeezed Generations
Gen Z (1997-2012) and Millennials (1981-1996) are shaped by high housing costs, weaker early-career income, and persistent uncertainty. In surveys, many Gen Z respondents describe a “soft saving” posture: prioritizing quality of life and experiences today over long-term accumulation.
Housing is the biggest expense, and it shows up as a stark age gap in housing cost burden (the share of income absorbed by housing). In the US, households headed by 25-34-year-olds spend 30% of pre-tax income on housing, versus 17% for 65+ households, who more often benefit from paid-off mortgages. In the UK, renters aged 25-34 spend 31% of income on rent, while 65+ homeowners spend a tenth. In Italy, younger adults who form independent households spend 31.6% of income on housing, while the 65+ cohort spends 15% on maintenance and utilities.
Once housing eats the margin, everything else becomes downstream. In the UK, ages 25-34 post the lowest saving ratio of any demographic, and a large minority of under-35s report having less than £1,000 in cash savings. In Italy, the demographic split is unusual: low entry-level wages and precarious contracts keep between 64.3% and 71.5% of adults aged 18-34 living with their parents (vs. EU’s average 49.4%). That arrangement functions as a “forced” safety net and it reduces visible hardship but delays independent household formation. In the US, Millennials carry the highest levels of student loans and credit card debt, and despite being in prime earning years, about 42% of Gen Z and Millennials live paycheck-to-paycheck (P2P) as of October 2025.
For younger cohorts, housing is the binding constraint - it compresses slack before lifestyle choices even enter the picture.
The Middle-Age Paradox: More Money, Less Liquidity
Middle-aged adults (Gen X, 1965-1980 and younger Boomers) sit at the intersection of peak earning power and peak financial obligations. In the US, household income peaks around ages 45-54, and that’s also when many households take on their largest, stickiest commitments.
This is the decade when the “Big Three” often peak at the same time. The culturally reinforced “successful adult” script (bigger home, better car, more comfort and convenience) can convert rising incomes into higher “defaults”, so liquidity doesn’t rise in step with income.
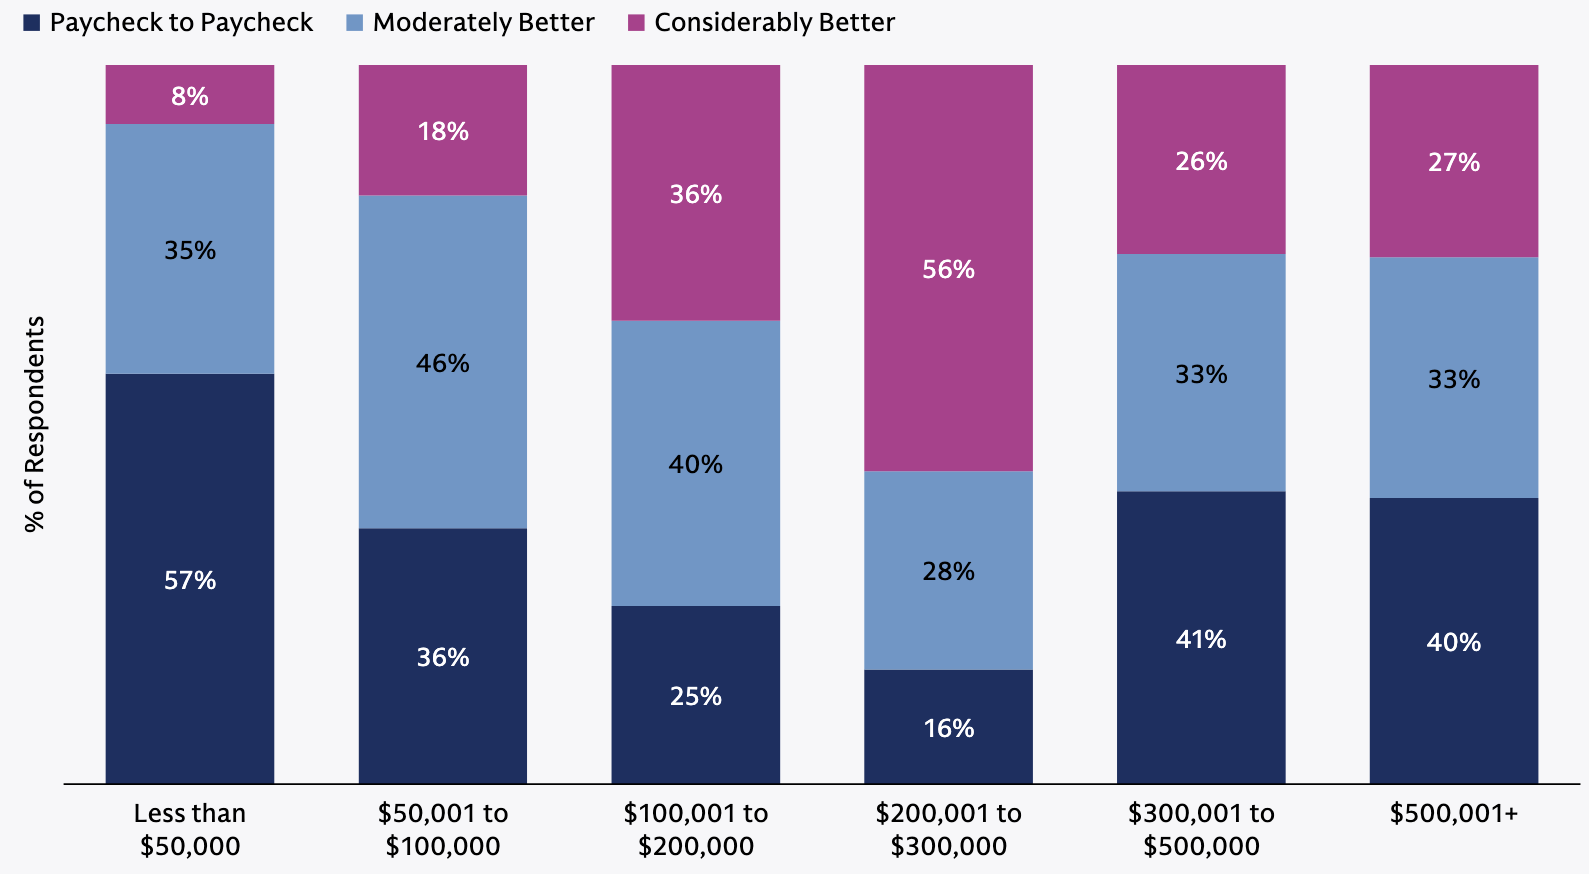
The data points line up with the pattern. In the US, Goldman Sachs’ 2025 Retirement Survey reports that 40% of people earning above $300,000/year say they live paycheck-to-paycheck, consistent with fixed commitments eroding slack even at high incomes.
In the UK, income tends to peak in the 40s, and expenditures are also highest in prime working ages, when mortgages/rents and family costs are most intense. In Italy, household expenditure is higher for working-age adults and higher-status professions than for older households; for example, a single person aged 35-64 spends €2,096/month versus €1,794/month for 65+, and managers/professionals average €3,386/month.
In the US, healthcare exposure and childcare can turn midlife into a peak-obligation period even at high incomes; in the UK and Italy, healthcare is not a private-cost shock, but housing and family costs still dominate the monthly baseline. The risk is locking peak income into peak fixed commitments.
In midlife, obligations peak alongside income, so even strong income can coexist with low liquidity if “defaults” expand with them.
Silver Wealth: Boomers and the Spending Power of Assets
Baby Boomers (1946-1964) sit in a different financial regime: their spending power is often driven more by accumulated assets than by current wages. In the US, Federal Reserve-based summaries put Boomers at 51% of total household wealth, far ahead of Gen X and Millennials, which helps explain why “silver spending” can stay resilient (travel, experiences, premium/luxury) even when younger cohorts retrench.
The key driver is balance sheet strength. In the US, older households are more likely to own homes, and decades of home-price appreciation converted ownership into net worth (often via paid-off mortgages and rising equity). They also benefited from an earlier retirement landscape where defined-benefit pensions were more common, before the shift toward 401(k)/defined-contribution plans pushed more retirement risk onto individuals.
The picture has an Italian analog. Home ownership is especially concentrated among older cohorts (76% of seniors own their homes), and historically higher pension replacement rates have helped stabilize retirement income. Research describes over-65s as being in a better economic condition than other age groups, reflecting the cumulative results of lifetime work, saving, investing, and real-asset ownership - often paired with lower day-to-day spending propensity, but meaningful capacity for discretionary spending when desired.
The constraint shifts from paycheck to balance sheet; assets (housing equity and pensions) can sustain discretionary spending even when younger cohorts are income-squeezed.
“HENRYs” – High Earners, Not Rich Yet
High Earners, Not Rich Yet (“HENRYs”) are households with high incomes but limited wealth, because spending and fixed commitments tend to scale up alongside income. The label is often used for $250k-$500k households in the US and £100k+ earners in the UK, and it’s common in high-cost cities where the “baseline” for housing, schooling, and lifestyle is already expensive. Goldman Sachs’ analysis notes that 32% of US HENRYs report living P2P.
The issue is that high income doesn’t automatically translate into slack when big-ticket decisions become structural. Upscale rent or a larger mortgage, premium childcare/schooling, car leases, and a higher “default” level of convenience can pre-commit a large share of monthly cash flow. On paper, income looks strong; in practice, liquidity can stay thin because obligations rise faster than savings.
Layered on top is status consumption. For the top 10% of earners, a larger share of spending shifts toward “Veblen goods”, luxury items where price itself signals status. Research suggests this cohort accounts for 49% of total US consumer spending, driven heavily by housing, luxury transport, and designer brands -categories that can be both identity-linked and hard to downgrade once adopted.
High income can still be fragile when “success” gets converted into fixed monthly commitments faster than wealth is built.
Lower Income and The Financial Struggle
At the bottom of the income distribution, the binding constraint is arithmetic, not “discipline”: essentials consume most of the paycheck, so slack is close to zero and many households live month to month.
This shows up as paycheck-to-paycheck being driven by necessity spending. One widely used Bank of America Institute definition classifies a household as P2P when “necessity spending” exceeds 95% of income, capturing what “making ends meet” looks like for 24% of low earners, even with disciplined spending.
The consequence is “dis-saving”. In both the US and UK, the poorest households often spend more than they bring in, covering the gap by drawing down savings, borrowing, or falling behind on bills. In the UK, Citizens Advice estimates over 2.1 million households (7.67% of the population) in England and Wales are in a “negative budget” (income too low to cover bare essentials), which predictably pushes people toward arrears and debt. In the US, BLS work finds personal saving is negative for the bottom half of the income distribution, and for the bottom 10% expenditures can be roughly double income.
Even under tight budgets, status pressures can distort choices and visible purchases can sometimes serve social-signaling or coping functions, though the primary driver of fragility remains essentials absorbing most income.
When slack is near zero, “cut spending” has limited leverage - financial fragility is largely structural, and any shock quickly becomes debt.
Middle-Class Squeeze vs. Lifestyle Creep
A meaningful share of P2P pressure in the middle class isn’t just lifestyle creep; it’s cost-of-living squeeze. The baseline cost of “normal” middle-class life has risen faster than incomes in many places, so era matters, not just age.
The story is fixed costs: housing first, then big-ticket essentials like healthcare (US) and childcare (UK). When these rise faster than income, slack shrinks before any discretionary choices enter the picture, and the same lifestyle can become fragile.
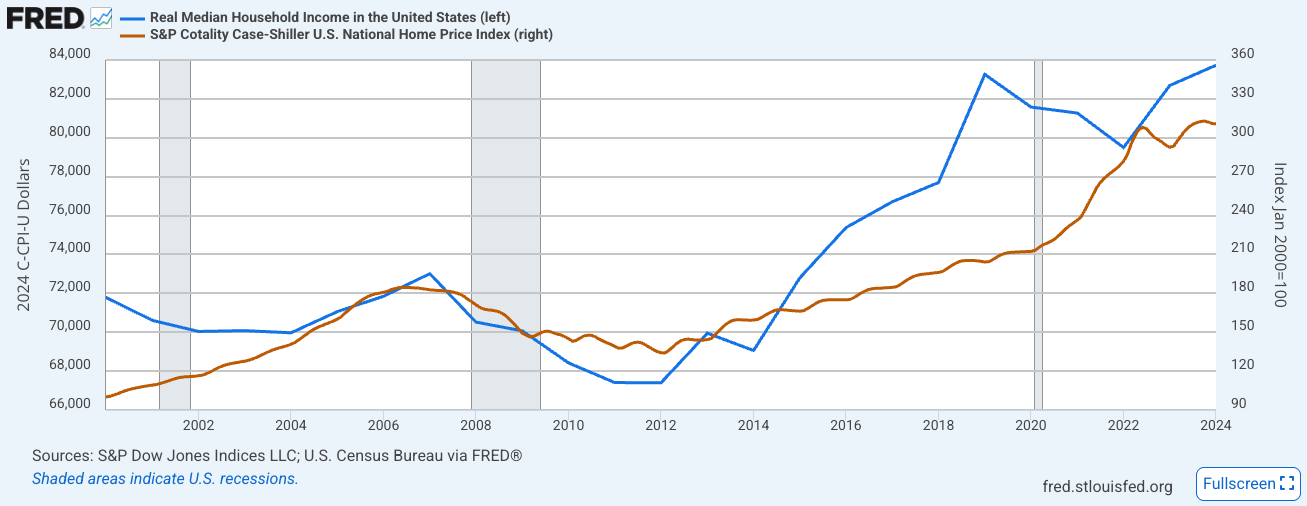
In the US, real median household income1 rose 16.6% from $71,790 (2000) to $83,730 (2024), while house prices rose 211% and healthcare spending has tripled - an imbalance that compresses slack even without upgrades.
In the UK, affordability deteriorated sharply: in 2002 the average home cost about 5x average gross household income; today it’s about 8.2x - levels of unaffordability not seen since the Victorian era.
In Italy, the issue is income stagnation: OECD highlights real wage decline over the past two decades, and Eurostat data confirms real household income per capita2 declined by 4% over 2004-2024, meaning essentials bite harder with less income momentum.
When the middle-class baseline absorbs the margin, lifestyle creep becomes more dangerous: with less slack, optional upgrades or small recurring commitments can tip budgets from tight to fragile.
The Squeeze vs. The Creep: What The Demographics Say
In summary, lifestyle creep is widespread across age and income groups, but it manifests differently. Younger adults often tilt spending toward experiences and immediate gratification, delaying long-horizon saving. Midlife and high earners are more likely to convert rising income into larger fixed commitments - sometimes to the point of financial fragility despite strong salaries. At the bottom of the income distribution, the binding constraint is usually arithmetic: essentials absorb most income, leaving little room to save. In other words, without deliberate restraint, a higher salary can simply finance a higher “default” lifestyle rather than translate into higher savings and long-term financial security.
A few reality checks matter. Some spending that looks like lifestyle creep is a rational trade-off: young families may pay more for safer neighborhoods, shorter commutes, or better schools. Cross-country comparisons also require humility - where public pensions, healthcare, and safety nets are stronger, households may rationally rely less on private saving. Not everyone is optimizing for net worth; some prioritize experiences and present quality of life, which can be reasonable if it doesn’t depend on debt or perpetual income growth. And for many households, the constraint is arithmetic, not behavior: fixed costs have eaten the margin. These nuances don’t contradict the lifestyle inflation story - they clarify the line between unavoidable squeeze and avoidable upgrades.
Final Thoughts
The most useful next step isn’t “be more disciplined”. It’s to diagnose what’s actually squeezing you, because different problems need different tools. Put your situation in one of three buckets.
If it’s arithmetic, essentials absorb the paycheck. Housing, utilities, food, transport, and basic bills leave little margin. In that case the priority is stability: avoid high-interest debt, build even a small emergency buffer, and don’t add new fixed costs. The highest-leverage moves are structural (income, benefits, housing choices, shared living, cheaper transport), not fine-grained budgeting - and one of the most durable levers on income is investing in yourself: building skills, credentials, and experience that let you progress in your current career or pivot to a better-paying role.
If it’s obligations, your problem isn’t low income; it’s contracts. A mortgage/rent at the edge, car payments, childcare/schooling, installments, and subscriptions have pre-committed most of your future cash flow. Here the goal is to stop hardening your baseline further and to unwind what you can. Treat every new monthly payment as a veto on future financial flexibility. Refinance where possible, eliminate “stealth” recurring costs, and pressure-test the “Big Three” before you upgrade anything.
If it’s upgrades, you do have slack, but it leaks into lifestyle defaults. This is where lifestyle creep is most dangerous because it feels harmless: small “yeses” that become “normal”. Your solution is default design: capture raises automatically (“pay yourself first”), add friction to impulse spending, and keep luxuries reversible. Make saving the path of least resistance so you’re not relying on willpower in an environment built to sell you convenience.
Once you name the squeeze, the right playbook becomes obvious. Arithmetic calls for stabilization. Obligations call for de-commitment. Upgrades call for guardrails. The mistake is applying the same generic advice to all three.
Real median household income is the inflation-adjusted income level of the “middle” household in a country: half of households earn more and half earn less. “Real” means it’s expressed in constant purchasing-power terms (e.g., in today’s dollars/pounds/euros), so it reflects changes in what households can actually buy over time rather than changes driven by rising prices. “Median” is used instead of the average because it’s less distorted by very high earners and better represents the typical household’s income trend.
Real household income per capita measures the average purchasing power of individuals by taking a nation’s total household income (after taxes, adding government benefits like free healthcare/education), adjusting it for inflation (making it “real”), and dividing it by the total population.