

Every figure here comes from Amazon’s Q2 2026 results, the Q2 10-Q and the 2025 10-K. I follow one disclosure as far as the filings allow.

On the Q2 2026 earnings call, CEO Andy Jassy put a number on the payback for Amazon Web Services (AWS) CapEx on servers and networking. Q2 2026 is the first time I can find Amazon quantifying it. The missing half is the building those servers sit inside, and the thirty-year life Amazon gives it is what my thesis rests on.
A sub-three-year break-even against a five-to-six-year life of servers and networking equipment produces an internal rate of return (IRR) of 23.1%, climbing to 27.3% in year six. Charge the building to the servers that carry the revenue across a thirty-year cycle and the AWS CapEx program returns 11.6-14%, depending on the mix. The dollar amounts move none of this. Only the break-even period, the useful life of servers and the shell life do.
The CapEx return math
This passage of the Q2 2026 call repriced the stock. Jassy:
“There are two major parts of the investment, the data centers and the servers and networking equipment that go into them. These have different capital cycles. Data center capital is spent starting two years before we can put servers into them to start monetizing. Once a data center opens with servers plugged in, we start generating significant revenue right away and then get to monetize these data centers for 30+ years without having to spend that startup capital again.”
Jassy described two assets running on different clocks. He priced one:
“For servers and networking equipment, on average, it takes a little less than three years to break even on that investment. The servers currently have a useful life of at least five to six years, and most of our AI capacity these days is being contracted for at least five-year terms.”
That “five to six years” describes operations rather than accounting: Amazon’s book life for a subset of servers stands at five years (trimmed from six in January 2025). I covered that reversal in Are AI Chips’ “Useful Lives” Creating Useless Earnings?. Jassy described what the hardware delivers.

Sizing the two buckets
Jassy’s claim covers the servers rather than the guided $220 billion. How big is that bucket?
The Q2 10-Q gives no cash CapEx split by segment, and what it does disclose in the segment note, is net additions to property and equipment. AWS consumed $90.1 billion of the $118.6 billion added in the first half of 2026, or 76%, against 62.7% a year earlier.

One caveat on that 76%: net additions and cash CapEx differ by $22.3 billion, because additions capture equipment received but unpaid and finance leases. The 76% shows direction rather than the exact split.
By asset life, the quarterly filings give me nothing usable. Both the Q1 and Q2 2026 10-Q mention useful lives of equipment once, in the estimates note, and say only that Amazon reviews them on an ongoing basis. Neither carries a property and equipment note, and neither breaks the spend into asset categories. That table appears once a year, in the 10-K. Note 3 of the 2025 10-K breaks gross property and equipment into categories.
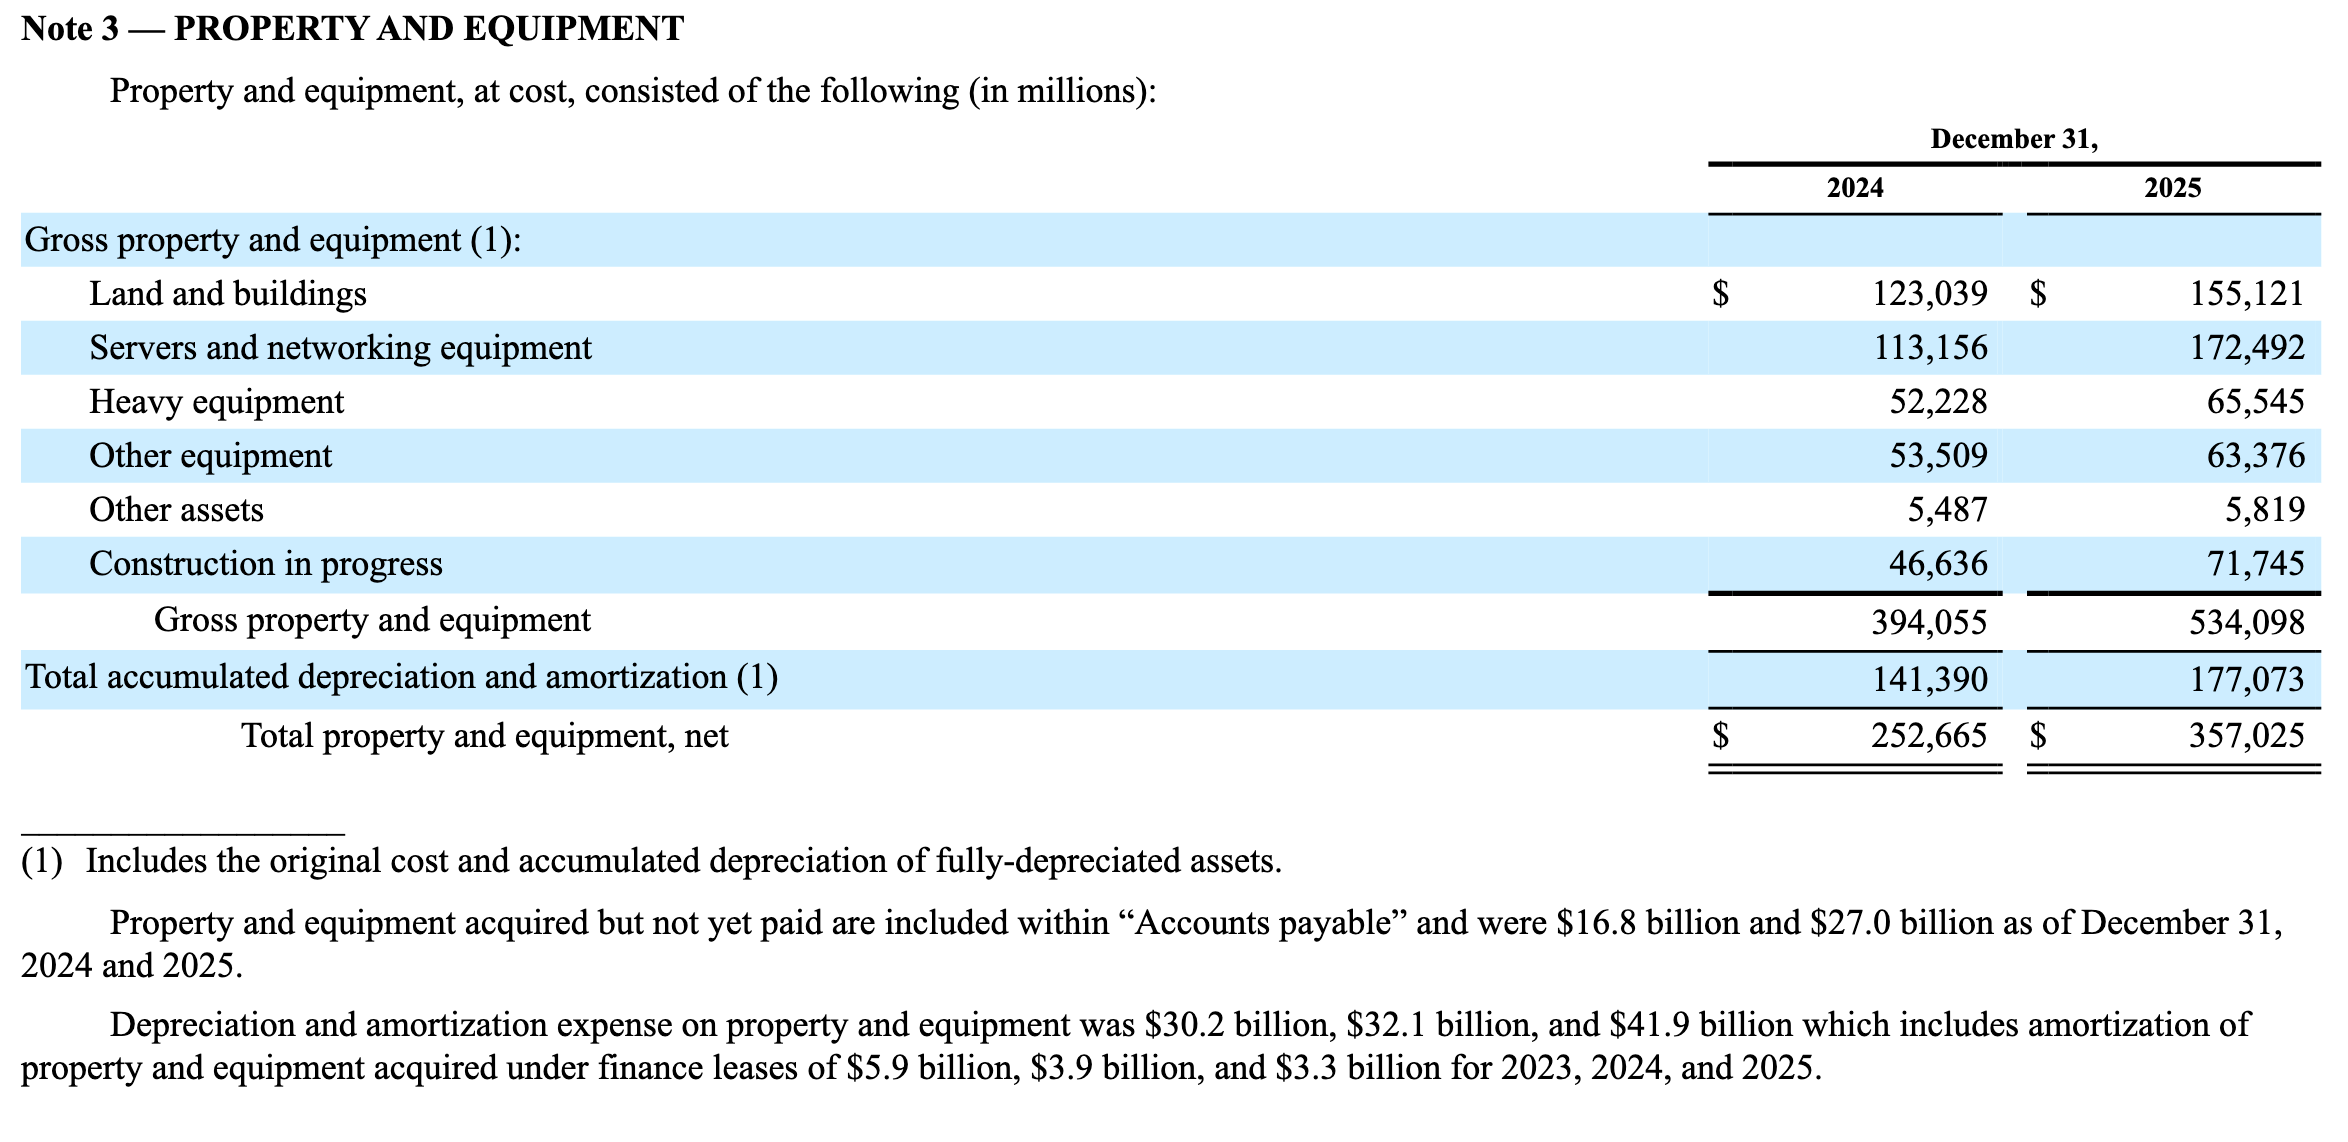
Servers and networking equipment added $59.3 billion in 2025, against $57.2 billion for land, buildings and construction in progress combined. Across the full $140 billion of additions that is 42.4% servers, 40.8% shells and 16.8% fulfillment, which Jassy excludes. Strip it out and his two categories divide 51/49. For 2026 I assume AWS consumes 80% of CapEx, above the observed 76%, on the view that retail CapEx plan stays flat and the cloud takes every extra dollar. The assumption is mine, not Amazon’s. Against the $200 billion CapEx plan, that is $160 billion for AWS and $40 billion for the rest. Apply the 51/49 split to the AWS share, then add the $20 billion memory increase Jassy attributed to component prices, landing wholly in servers:
$160 billion x 51% = $81.5 billion of servers, plus $20 billion of memory = $101.5 billion $160 billion x 49% = $78.5 billion of data centers, land and power
AWS 2026 CapEx plan is therefore $180 billion: $101.5 billion of servers against $78.5 billion of data centers, a 56/44 split.
Servers and networking equipment is AWS-only (Note 3, second row). Land, buildings and construction in progress is company-wide, carrying fulfillment centers and Whole Foods stores the filings give me no way to separate from data center shells. Therefore, I assume a cleaner 65/35 mix alongside it: $117 billion of servers against $63 billion of data centers.
The server and networking math, the half Jassy gave
Break-even means cumulative cash equals the money invested. Read “a little less than three years” as 2.8. Servers repaying their cost in 2.8 years must earn that cost divided by 2.8 each year: $36.3 billion at 56/44, $41.8 billion at 65/35.
Spend more on servers and you get proportionally more cash back, so the dollar amounts cancel and both mixes land on the same return. After that, every extra month is near pure return. A sixth year adds 4% CAGR. Per Note 5 - Debt of the 10-Q, Amazon’s senior notes carry a weighted-average effective annual interest rate of 4%. Borrowing at 4% to fund server assets yielding 23-27% leaves a spread of 19 to 23 points.
The data center math, the half Amazon left out
Apply the 2.8-year break-even to the whole $180 billion:
Both columns commit $180 billion and generate different cash flows. Only the servers earn. Why so far under what a four-to-five-year payback implies? Two years of construction come first. The shell absorbs capital and returns nothing:
Monetization starts in year 2, when the servers land.
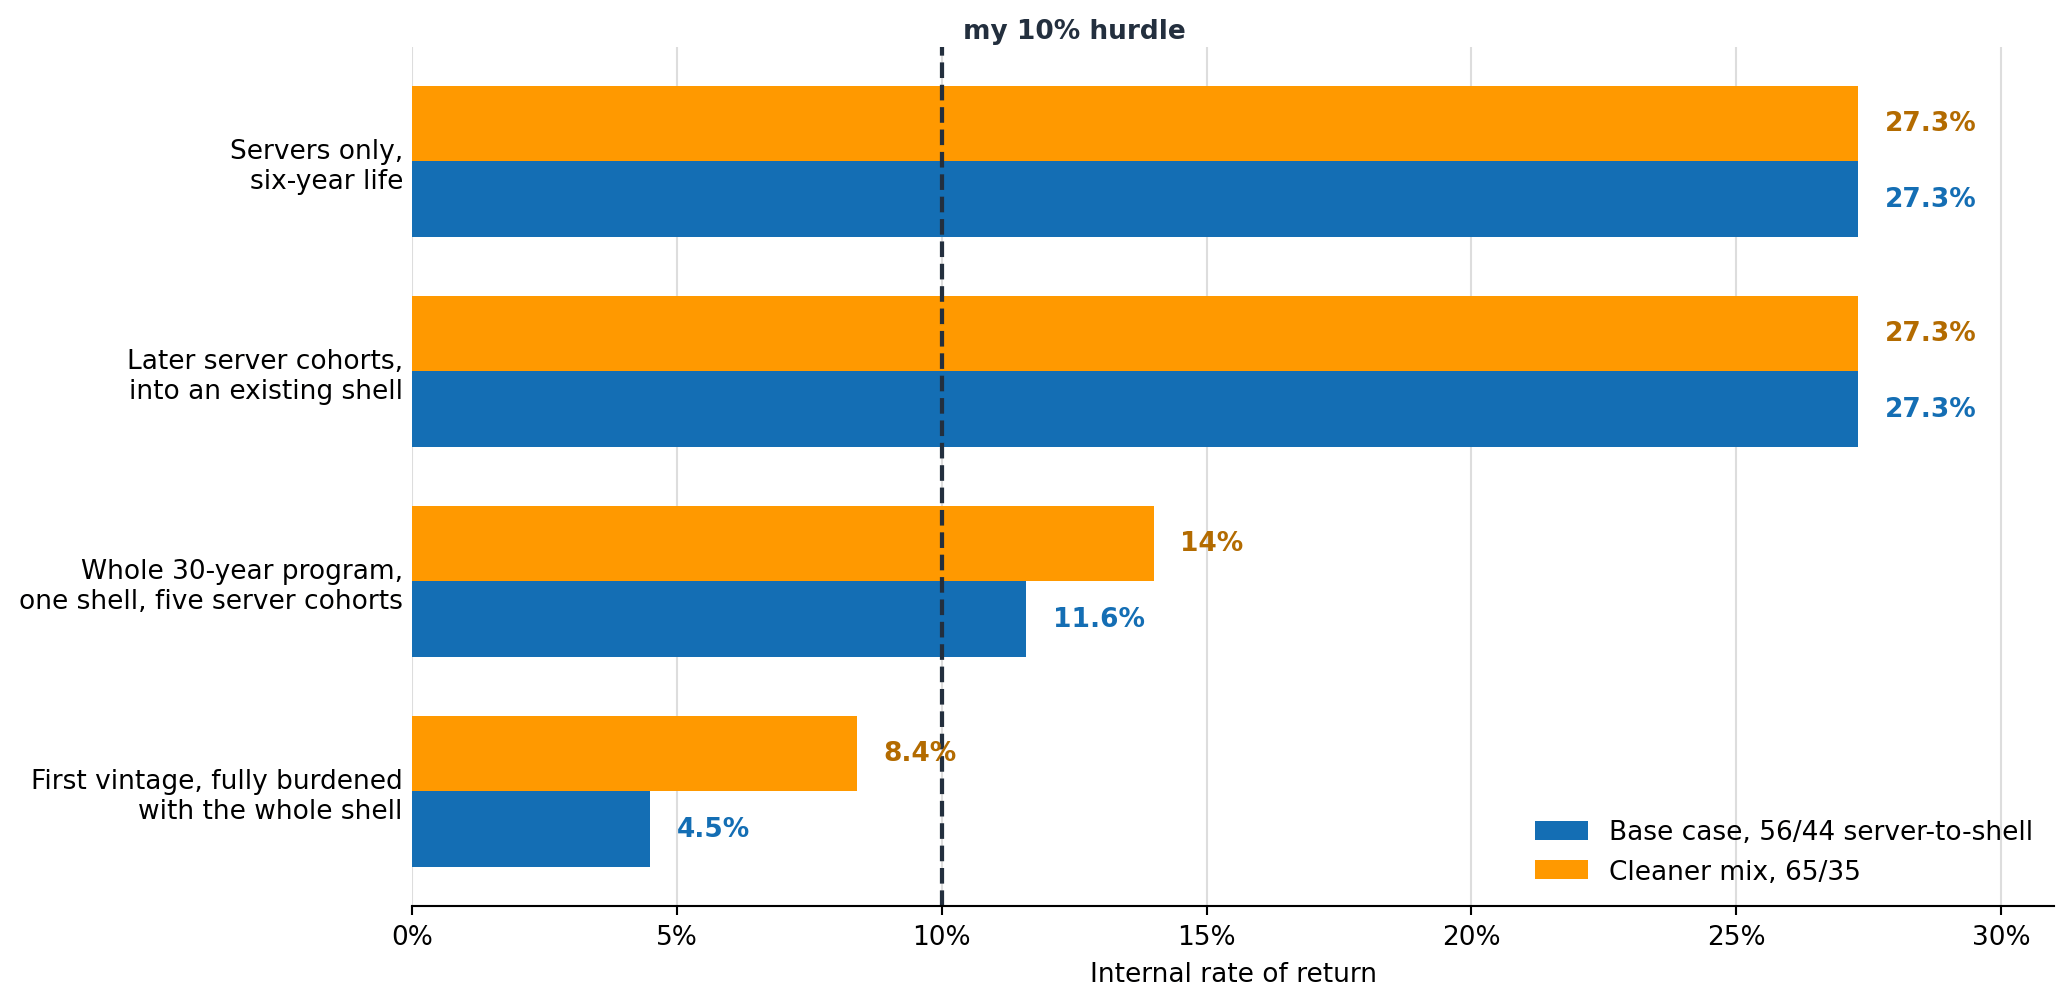
A later server cohort drops into a shell already paid for. Carrying no building cost, it earns the servers-only IRR: 23.1% at five years, 27.3% at six. Both program figures hold cash per generation flat and grant no price-performance gains. Amazon buys one building and five sets of servers per shell life, so the CapEx full-cycle mix settles near 87-90% servers.
Today’s growth runs on 2024 capital
The 36.7% AWS growth in Q2 2026 owes nothing to the $220 billion Amazon is spending now, because it came out of capacity commissioned around 2024.
CapEx then ran at under half today’s rate.
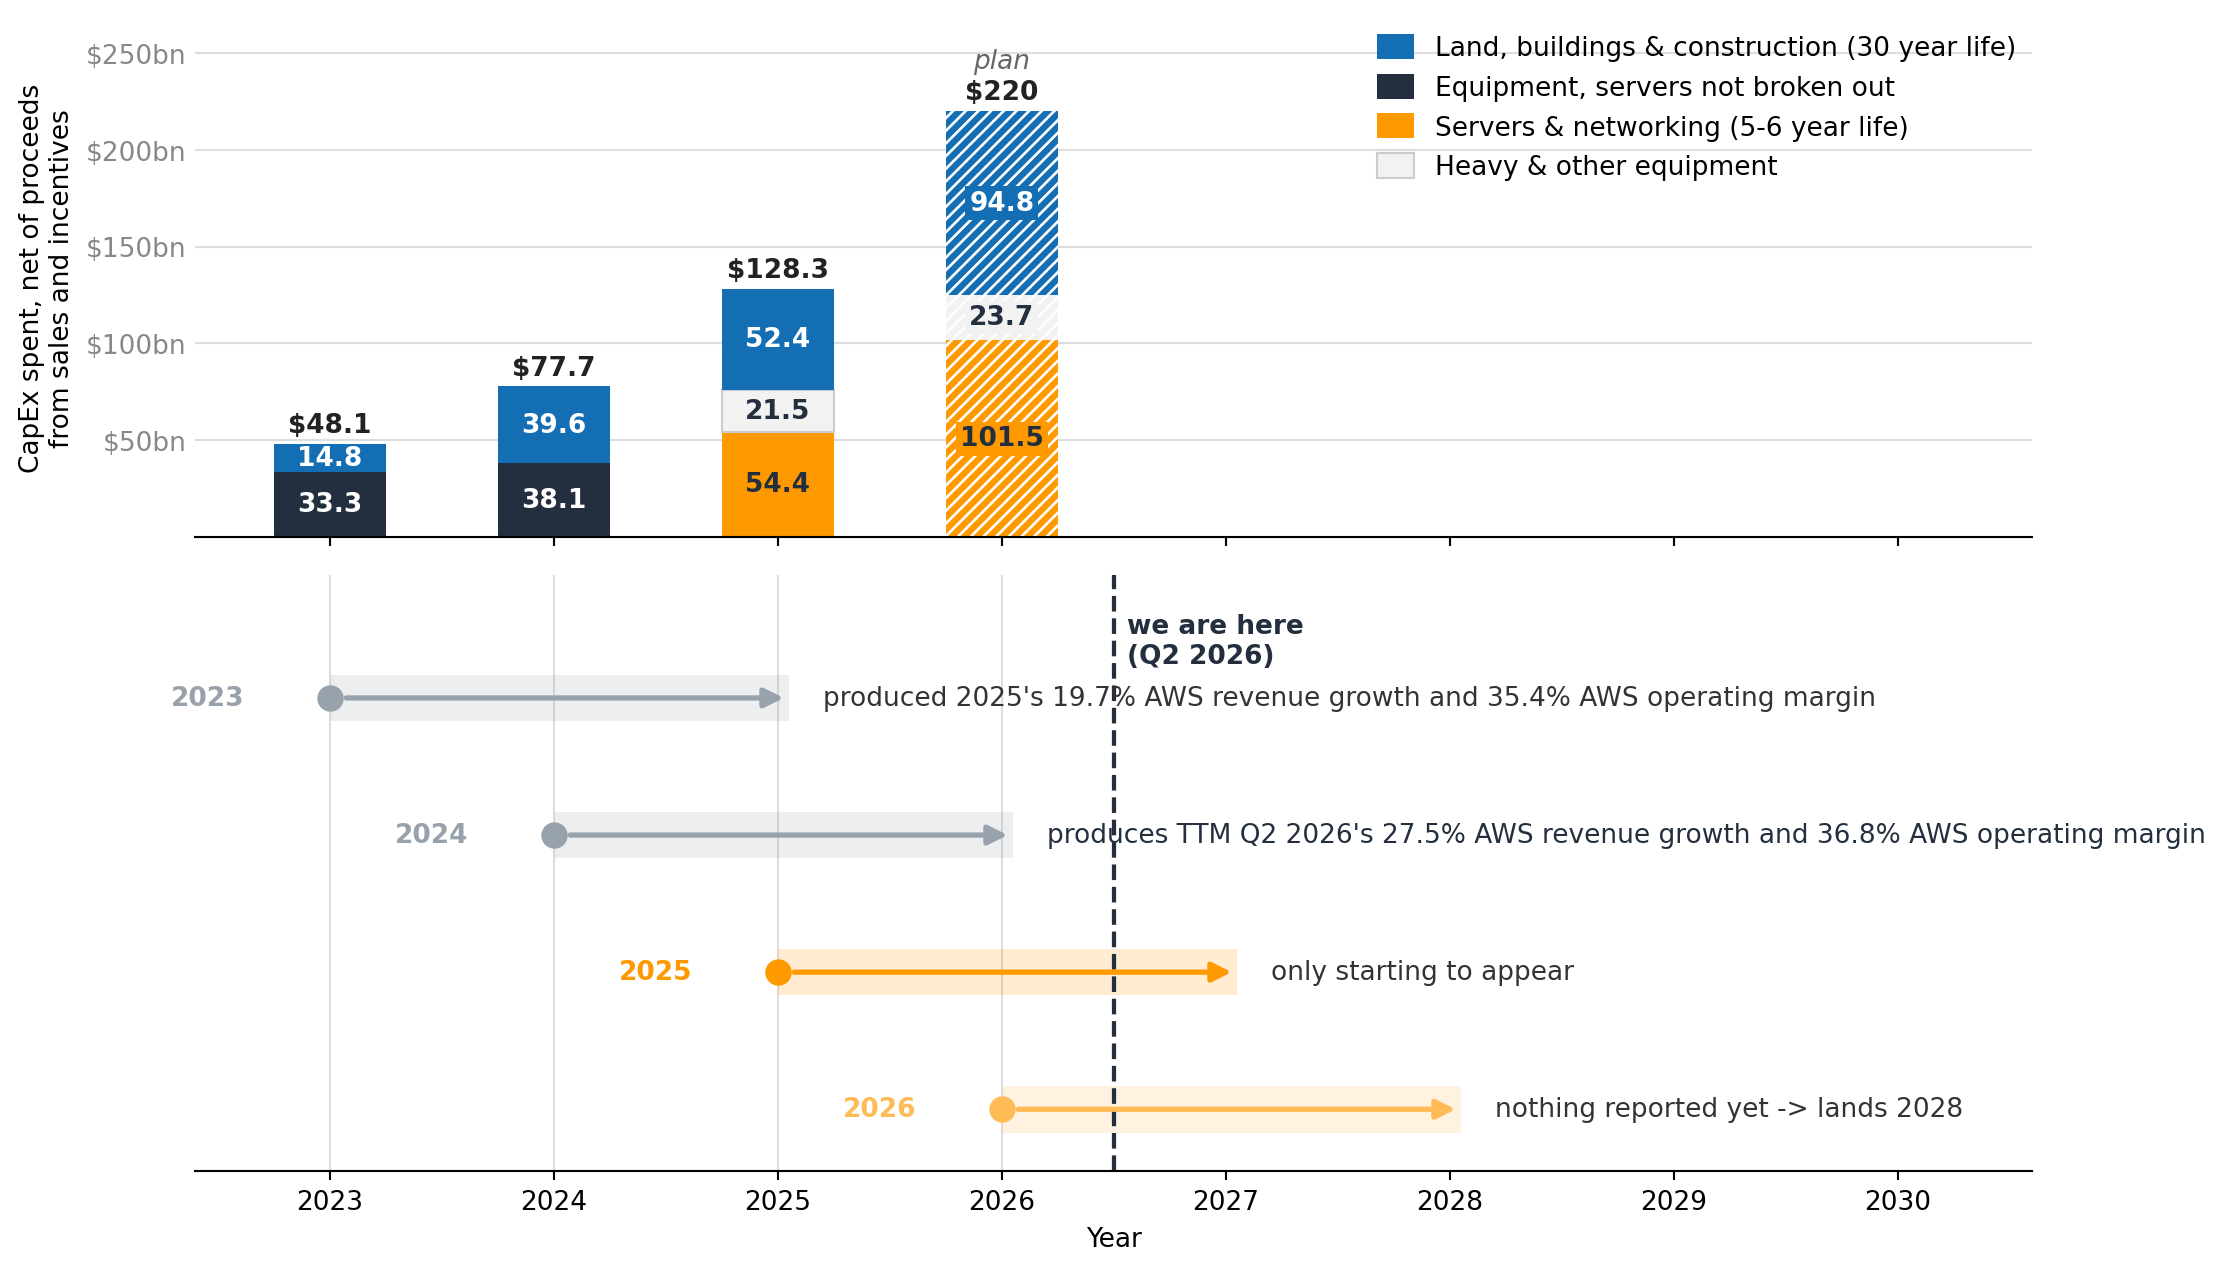
The growth rate and the spending rate in the same quarter describe different years. Judging the $220 billion by today’s 36.7% is judging it on someone else’s work. Its own verdict arrives in 2028.
What the answer rests on
Eight inputs carry the answer: three leave the return untouched, two move it inside a range I can bound, and one decides it.
I find three objections convincing, ranked from strongest:
The break-even is a company claim with no filing behind it. Jassy said “a little less than three years”. The 2.8 is my reading of that phrase, not a figure Amazon published.
Attributing every dollar to the servers is a choice: A shell that arrives powered and connected is part of what customers buy, so split the cash and the 23-27% server return falls, though the program return holds.
The model charges the building no maintenance capital: It buys the shell in year 0. Three decades of use follow. Power distribution, cooling and network gear are not servers. They do not last thirty years untouched. No filing discloses replacement capital for them.
Final thoughts
The same dollars produce four different returns, and the only thing separating them is who pays for the building. I underwrite the middle answer, the 11.6% to 14% CapEx program IRR range, where every set of servers pays toward the shell it sits in.
What would change my mind is how long those servers keep paying. At six years a server earns 27.3% and the program 11.6% to 14%. At five, the server falls to 23.1% and the program to 9.7% to 11.7%, in line with my 10% hurdle.
Amazon can put $180 billion to work in a single year and still clear my hurdle after charging every dollar of the building to the servers. Very few businesses have that problem.
The split between the roughly three-year server payback and the thirty-year building life is the key point here. The return math looks very different depending on which asset carries the revenue.