
Amazon's Q2 2025 Results: Still Early at $123B AWS Run Rate
Re-acceleration across Retail and Ads, AWS demand locked in, and CapEx as a feature, not a bug

“At Amazon, we think of our business in terms of inputs and outputs. Outputs or metrics like revenue are operating margin. But of course, you can’t manage at the output level, it’s the inputs that drive the outputs. So we spent virtually all of our time internally talking about and goaling against inputs.” – Andy Jassy, Amazon CEO
This is Amazon’s operating philosophy in one breath. Outputs like revenue and margin are results, they lag and can’t be controlled directly. So the company obsesses over the inputs it can steer every day: selection breadth, price sharpness, delivery speed, in-stock rates, defect rates, and the underlying logistics and compute capacity that power them. By goal-setting on these inputs, and measuring them relentlessly, Amazon improves customer experience first, letting the financials follow. For investors like me, it explains why management tolerates near-term margin noise: consistent input gains compound into durable share, cash flow, and structural advantage.
Amazon.com Inc. (AMZN 0.00%↑) reported its Q2 2025 earnings results (earnings’ slides) on July 31, 2025, delivering strong financial results, yet the market reacted negatively, sending the stock down by 8.6% the next day. Investors came in primed by Google and Microsoft’s cloud growth and then fixated on AWS’s +17.5%. On that single metric, shares wobbled. On the full picture, this was one of Amazon’s most impressive quarters: growth re-accelerated, margins held up where they matter, and the flywheel turned faster across retail, ads, and infrastructure.
The Quarter in Five Numbers
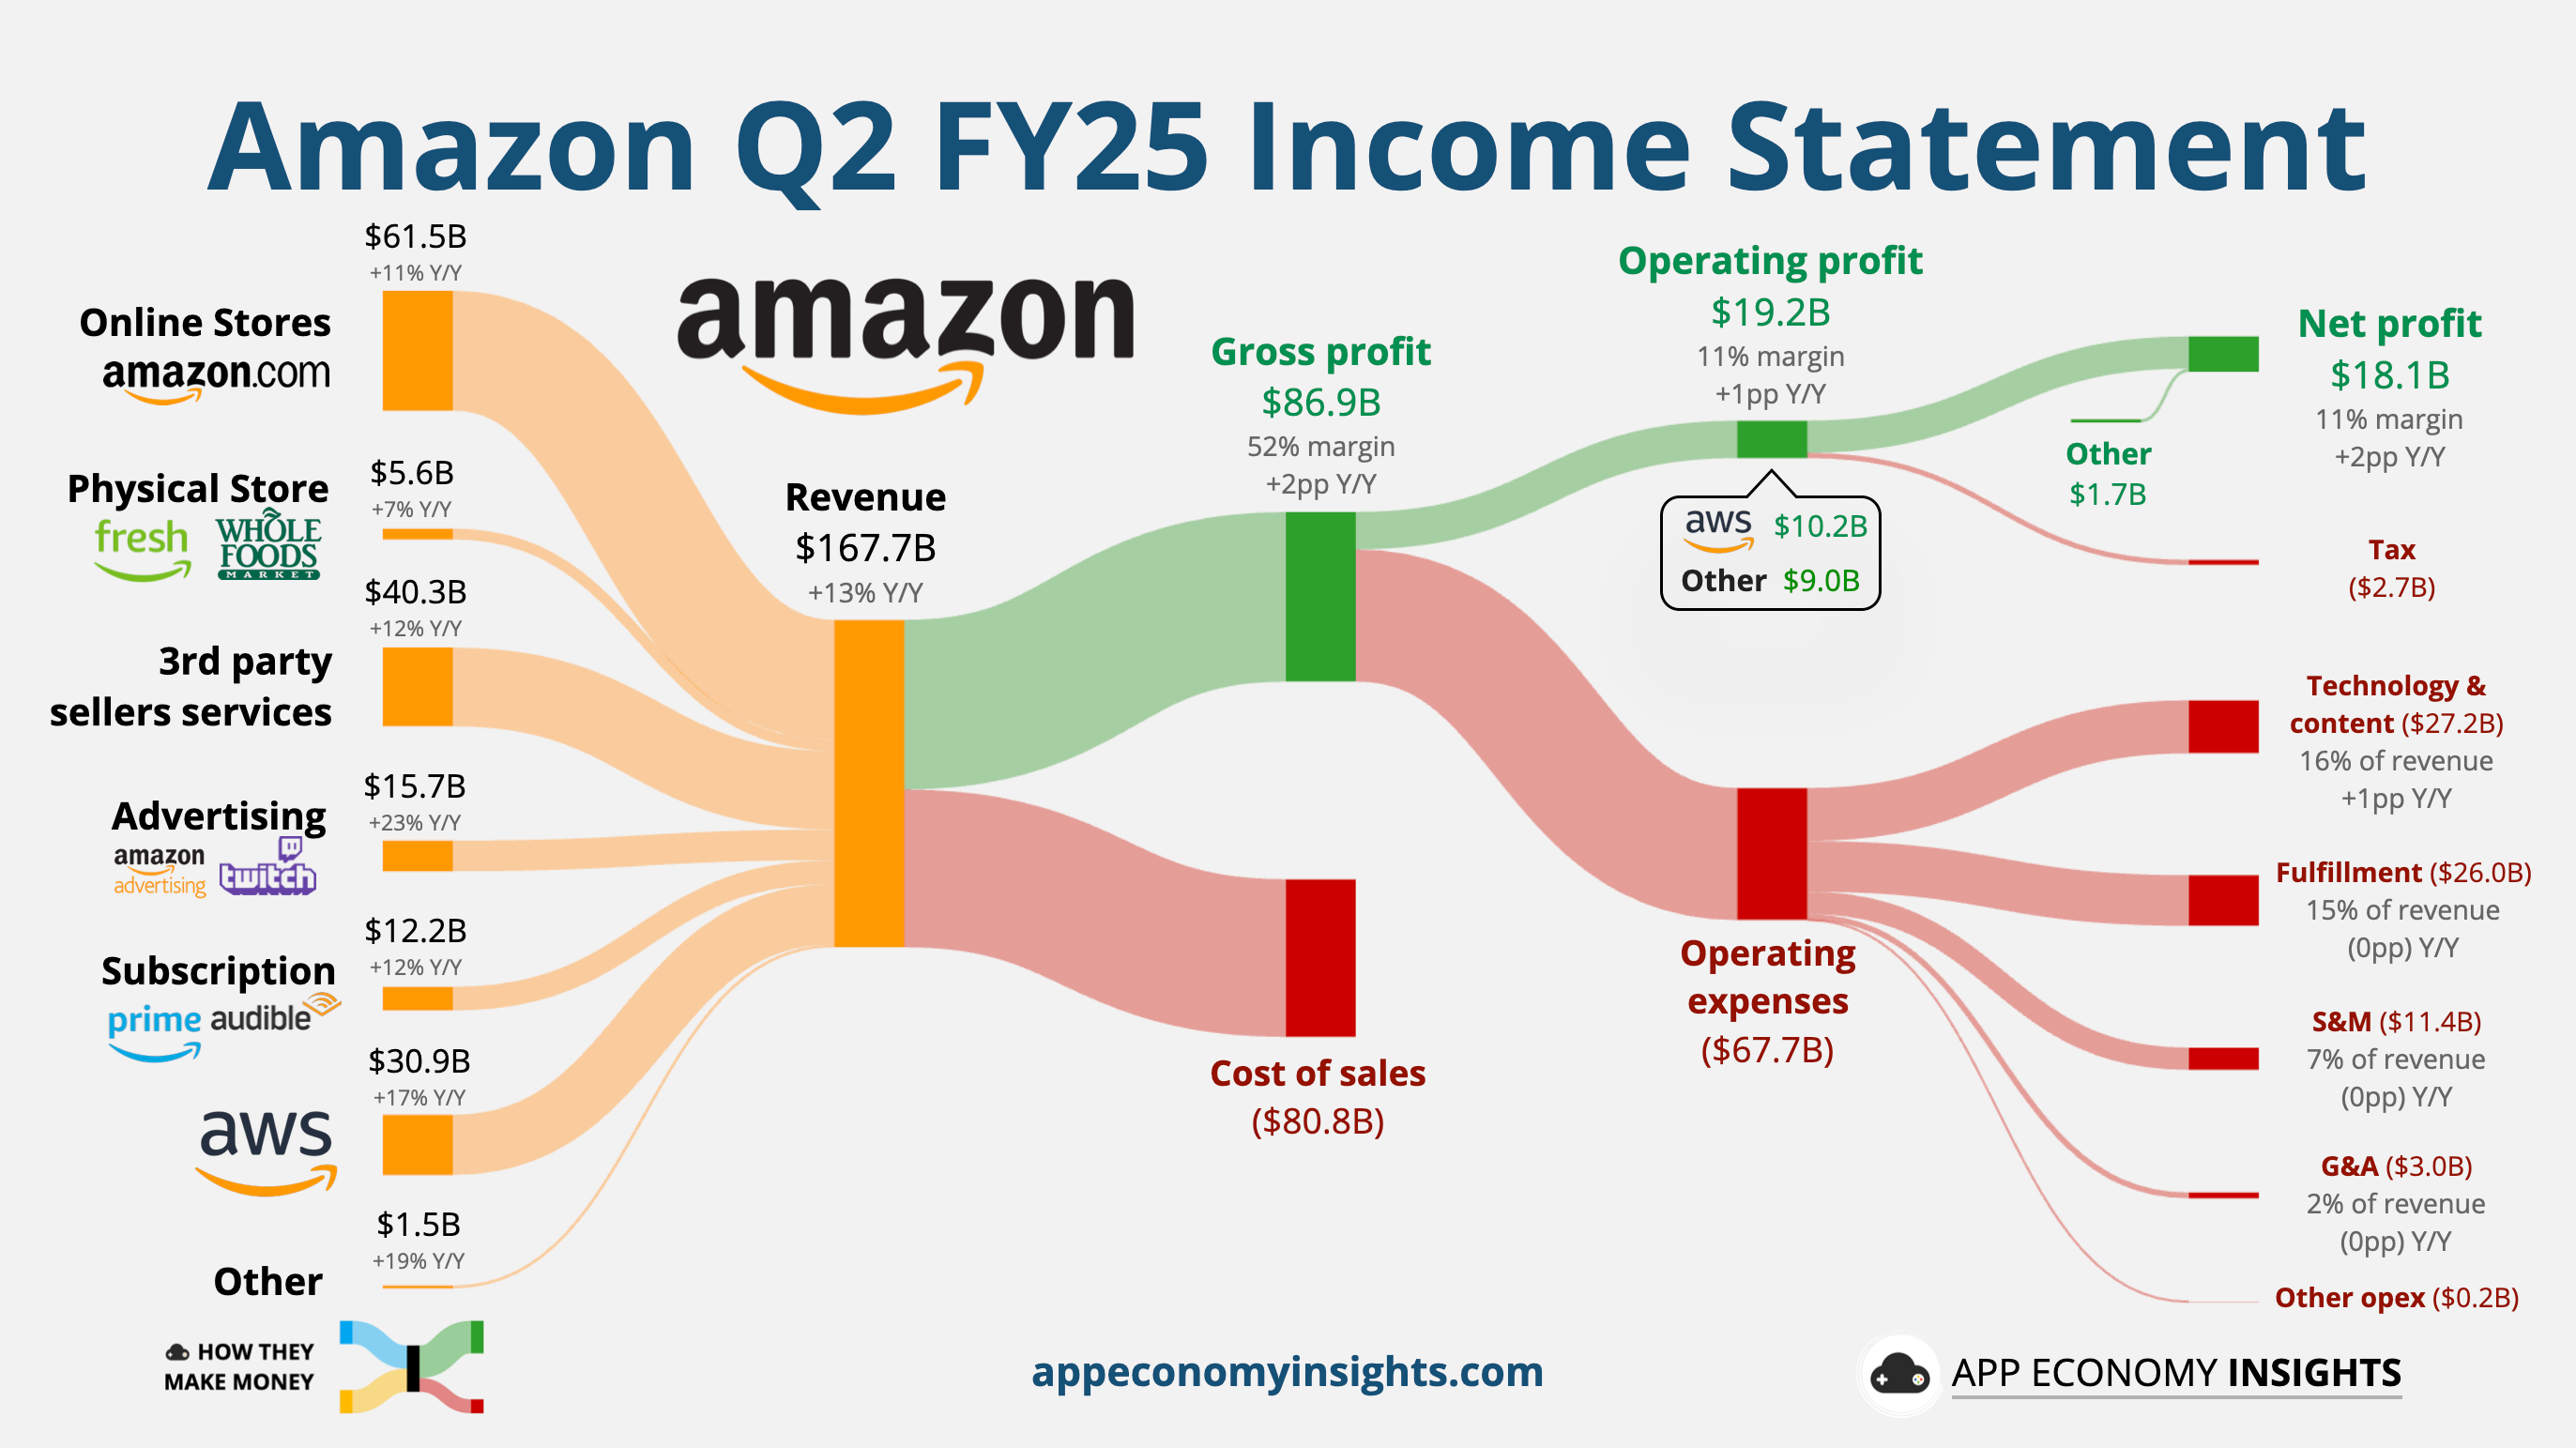
$167.7 billion revenue, +13.3% Year-on-Year (YoY).
$19.2 billion operating income, +30.6% YoY (above the high end of guidance) with operating margin firmly above 11%.
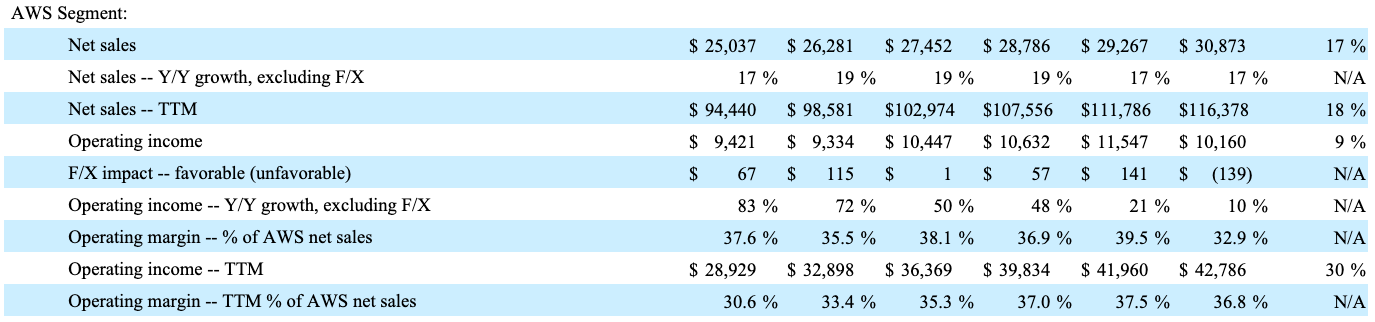
AWS revenue $30.9 billion (+17.5% YoY), with decelerating operating income $10.2 billion growth (+9.3% YoY).
International segment operating income $1.5 billion, with operating margins expanding 4.6x.
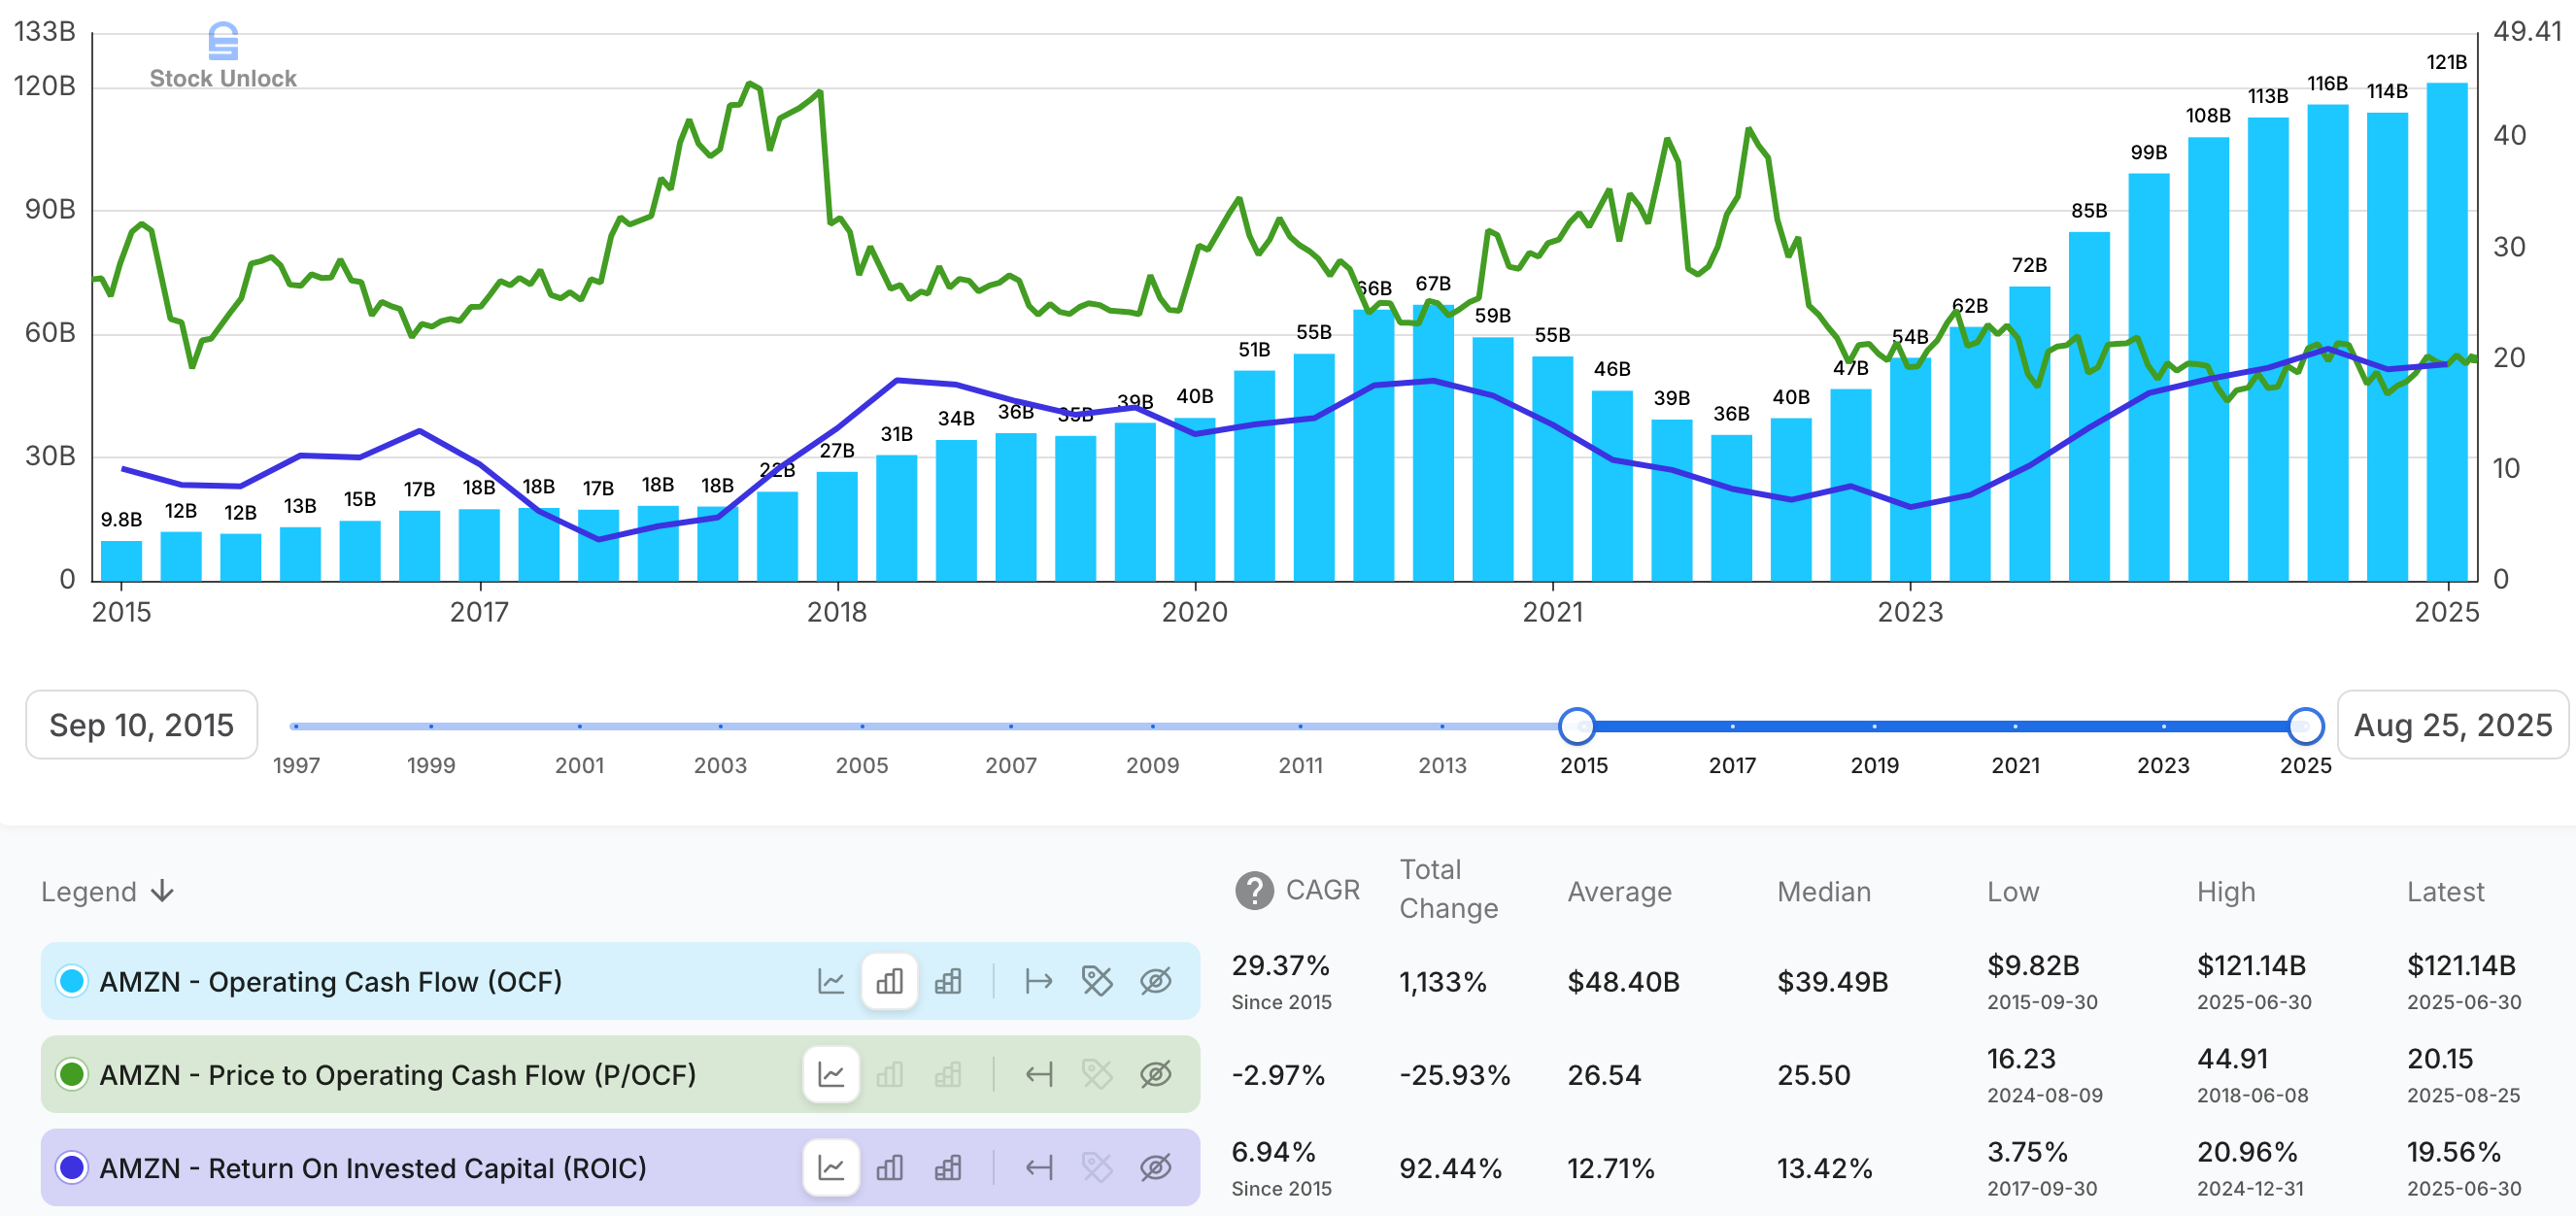
TTM operating cash flow (OCF): $121.1 billion, +12% YoY.
Strong Financial Performance
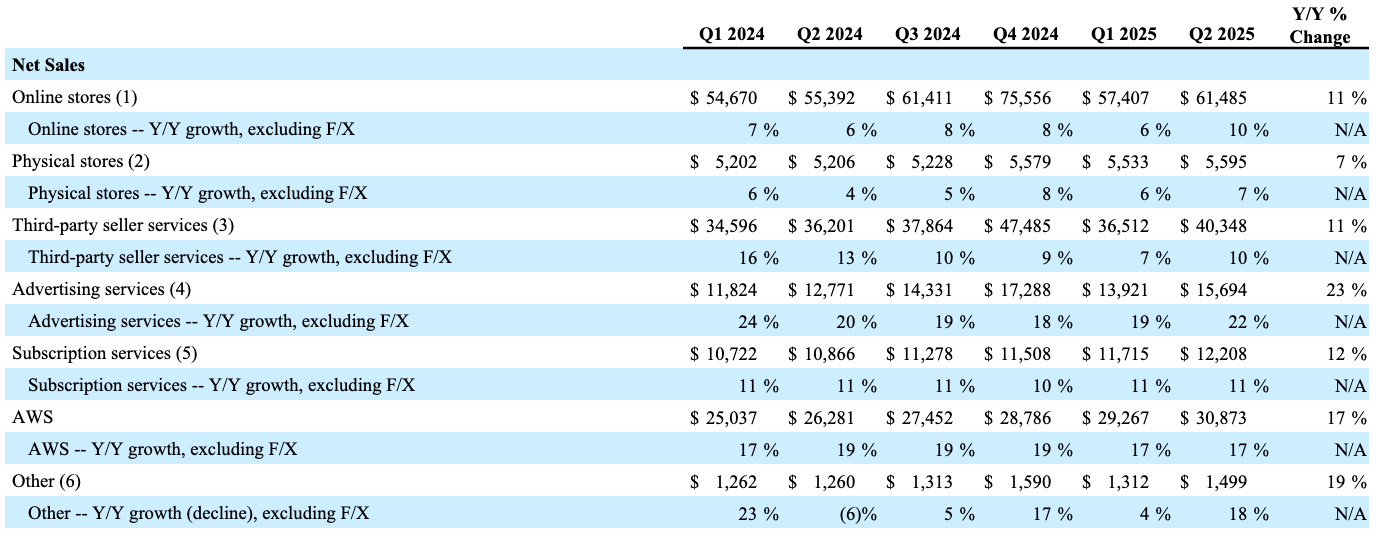
Amazon delivered a strong Q2. Revenue reached $167.7 billion, up 12% YoY, and translated into $19.2 billion of operating income, a+30.6% YoY, comfortably ahead of expectations. The growth engine is broad: Advertising advanced to $15.7 billion (+22% YoY), while AWS posted $30.9 billion (+17.5% YoY), now running at a $123 billion annualized clip. Just as important, AWS’s $195 billion backlog (+25% YoY) signals durable, multi-year demand even as capacity additions and power constraints ease over time.
Management is leaning in: $32.3 billion of capital expenditures (CapEx) in the quarter, with a similar cadence flagged for the second half of 2025. That reinvestment (chips, data centers, power, and logistics automation) adds near-term depreciation but supports earnings growth for years. Net-net, the quarter combines top-line re-acceleration with healthy profitability and record ad momentum, while outsized CapEx seeds the next leg of growth.
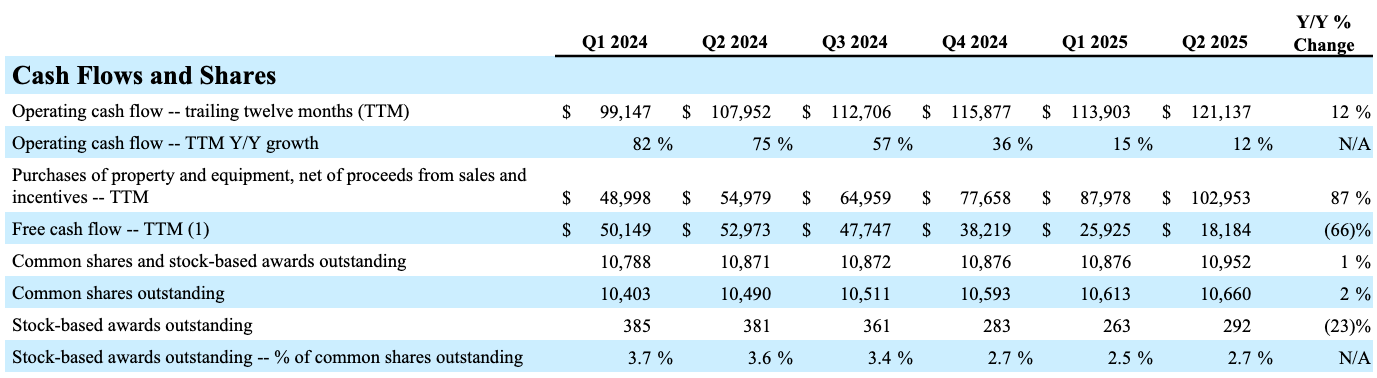
Amazon maintained financial discipline converting earnings to hard cash: Trailing twelve months (TTM) operating cash flow (OCF) reached $121.1 billion, a 12% increase YoY and they have poured $103 billion into CapEx over the same period. This highlights Amazon’s ability to generate strong cash flows, which are critical given its aggressive reinvestment strategy in cloud infrastructure, AI and logistics.
Retail: Prime Day Records & Structural Speed
Amazon’s core retail flywheel accelerated in Q2: both online stores and third-party seller services’ revenue advancing 11% YoY. Jassy said “Prime Day was our biggest ever with record sales, number of items sold and number of prime sign-ups”. With regards to tariffs, the CEO commented “we haven’t yet seen diminishing demand nor price is meaningfully appreciating”. He also highlighted Amazon’s standing as the lowest-priced U.S. retailer for the eighth consecutive year, and detailed concrete logistics gains: a 40% lift in orders routed via direct lanes (fewer stops), a 12% cut in average miles traveled per package, ~15% fewer handling touches, and better order consolidation; changes that are “making the network faster and structurally more efficient” leading to “record delivery speeds for Prime members”. In addition, Amazon deployed its millionth robot and rolled out DeepFleet, an AI traffic system that has already improved robot routing ~10%. Complementing these operational wins, CFO Brian Olsavsky noted outbound shipping costs rose 6% while paid units grew 12%, evidence of positive leverage; he also pointed to a record 62% third-party unit mix, reflecting a marketplace that broadens selection and sharpens prices, key inputs that continue to power the retail engine.
North America: Margin Muscle at Scale
North America tightened the screws on profitability: operating margin climbed to 7.5% from 5.6% a year ago, about a 2% lift that translates into billions of incremental operating profit at Amazon’s scale. The move reflects denser local inventory, more same-/next-day deliveries from a regionalized network, higher units per box, and shipping costs rising slower than unit growth, with advertising mix providing an extra tailwind.
International: Margin Breakout
International segment more than quadrupled profitability, with operating margin rising to 4.1% from 0.9% a year ago (4.6x). The step-up came from broad productivity gains, translating into faster deliveries at lower cost. Mature markets (UK, Germany, Japan) increasingly resemble the U.S. on margin, while newer countries are steadily improving, shifting the mix toward profitability. Net result: a structurally leaner international network converting scale into earnings.
Advertising: Full-Funnel Growth, Bigger Pipes
While some investors over-focus on AWS growth rate lagging behind Microsoft Azure and Google Cloud, advertising was a standout performer again, advancing 22.9% YoY to $15.7 billion in Q2 revenue, accelerating versus +19% in Q1 2025 and +20% in Q2 2024. Notably, Amazon’s ad business grew faster than both Google’s ads segment (+10% YoY) and Meta’s ads business (+21% YoY), underscoring how Amazon continues to attract more advertisers to its platform thanks to its rich commerce data, expanding surfaces, and strong performance metrics. At this scale, Amazon’s ad business represents roughly 29% of Google Search ads, 34% of Meta’s ad revenue, and an impressive 160% of YouTube ads – solidifying its position as the third-largest player in global digital ad spend and widening its lead over YouTube over the past four years.
Amazon is building a formidable advertising ecosystem. As Jassy framed it, Amazon now reaches an average 300 million ad-supported audience in the U.S. across its own surfaces – the retail marketplace, Prime Video, Twitch, Fire TV, and live sports (NFL, NASCAR, NBA) – plus third-party sites via Amazon Demand-Side Platform (DSP). Two new pipes widen the funnel further: a Roku partnership unlocking 80 million connected TV (CTV) households exclusively through Amazon DSP, and a Disney ad exchange integration for direct access to Disney+, ESPN, and Hulu inventory – both paired with Amazon’s audience insights and measurement tools to sharper ad performance.
AWS: Demand Locked In, Capacity Ramping
Global enterprise spending on cloud infrastructure services hit nearly $99 billion in Q2 2025, up over $20 billion YoY – marking the third straight quarter of 24-25% annual growth and a sharp acceleration from the 19% average in 2023. The surge is driven largely by generative AI, with GenAI-specific cloud services growing 140-180% YoY.

AWS retained its lead with a 30% market share in Q2 2025, ahead of Microsoft Azure (20%) and Google Cloud Platform (13%), though Microsoft and Google posted faster percentage growth. AWS posted $30.9 billion, up 17.5% YoY, and now operates at a $123 billion annualized run rate (Microsoft Azure’s ~$75 billion and Google Cloud Platform’s ~$50 billion). With that scale, slower percentage growth is the natural base effect, not a demand problem. As Jassy put it:
“How often do you have an opportunity that’s $123 billion of annual revenue run rate where you say it’s still early? It’s a very unusual opportunity that we’re very bullish about.”
He also noted that “year-over-year percentages and growth rates are always a function of the base in which you operate. And we have a meaningfully larger business in the AWS segment than others”.
The momentum remains strong: performance obligations (backlog) climbed to $195 billion, up 25% YoY, underscoring multi-year commitments from customers. Management reiterated a long runway: ~90% of global IT spend still sits on-premises, a mix they expect to flip over the next 10-15 years, accelerated by AI adoption.
Near term, profitability margin stepped down from a record high of 39.5% in Q1 to 32.9% in Q2 as the segment absorbed a seasonal stock-based compensation (SBC) step-up and higher depreciation from last year’s heavy build – exactly what you’d expect during a growth CapEx super-cycle. As Olsavsky emphasized, “we expect AWS operating margins to fluctuate over time, driven in part by the level of investments we are making at any point in time”.
I’m not concerned about quarterly fluctuations in AWS’s profitability margins or those of other Amazon segments. What matters to me is the long-term strategy: investing heavily today to expand capacity, scale infrastructure, and ultimately drive operating leverage. I’m aligned with Amazon’s leadership and fully expect CapEx super-cycle and depreciation to weigh on the bottom line in the near term. To me, these are investments that will sustain growth and expand margins in the years ahead, much like Amazon’s aggressive logistics network build-out during COVID-19, which temporarily compressed margins but has since unlocked enduring efficiency and scale advantages we continue to see today.
Supply, not demand, remains the limiting factor, with power as the tightest constraint alongside chip availability and server ramp timelines. These pressures should ease gradually over the coming quarters. As Olsavsky noted, “we will continue to invest more capital in chips, data centers and power to pursue this unusually large opportunity that we have in generative AI”.
Part of Amazon’s strategy to address these power constraints involves securing access to renewable energy at scale. In late 2022, Amazon signed a power purchase agreement (PPA) with Brookfield Renewable, a subsidiary of Brookfield Corporation (BN 0.00%↑), for over 600MW of clean wind and solar energy across Europe, North America, and India. This collaboration directly supports Amazon’s goal to power its operations with 100% renewable energy and reach net-zero carbon emissions by 2040. As part of the deal, AWS also became Brookfield’s preferred cloud provider, reinforcing a mutually beneficial partnership that strengthens Amazon’s long-term infrastructure and sustainability ambitions.
Jassy echoed this strategy, adding that while capacity constraints won’t be fully resolved in the next couple of quarters, he expects steady improvements each quarter and remains confident in AWS’s ability to scale with surging demand.
On the product side, Jassy emphasized that the real cost driver of AI at scale will not be training, but inference. While models are trained periodically, the constant flow of predictions and outputs makes inference the dominant expense, potentially 80%-90% of total costs. This shifts the competitive battleground toward compute efficiency, where Amazon believes it has a clear edge. Its Trainium2 custom chips have already become the backbone of Anthropic’s next-generation Claude models and power much of the inference running on Bedrock, Amazon’s managed foundation model service. Jassy highlighted that Trainium2 delivers roughly 30-40% better price-performance compared to other leading GPU offerings, allowing customers to deploy and scale models more cost-effectively. With the third generation of Trainium already in development, Amazon is positioning AWS as the most efficient platform for hosting and serving generative AI applications at scale, a crucial advantage as workloads grow exponentially.
To move enterprises from pilots to production, AWS shipped Strands to build agents and Agent Core, a secure, serverless runtime to deploy them. At the application layer, AWS Transform targets mainframe/VMware/.NET migrations, while Kiro, an agentic coding environment, aims to speed software development.
Put together, AWS remains early in a much larger transition, investing through the cycle to convert backlog and AI enthusiasm into durable, high-return workloads.
Project Kuiper: Building the Second Modern LEO Network
Amazon’s low Earth orbit (LEO) broadband effort is moving from proof points to commercialization. Although Kuiper isn’t live yet, Amazon has already signed a meaningful slate of enterprise and government customers, reflecting demand for secure, high-throughput Internet connectivity – particularly in regions where hundreds of millions still lack reliable broadband. Management positions Kuiper as one of only two modern LEO constellations once deployed, with performance designed to compare favorably to today’s incumbent Starlink and pricing aimed to be compelling across consumers, enterprises, and governments. The strategic kicker is tight integration with AWS: data down-linked from space can flow directly into AWS for analytics, AI, and operations – an end-to-end value proposition that resonates with enterprise and governments customers. On execution, Amazon has secured most of the launch slots it needs, acknowledged some delays from rocket providers, and remains focused on ramping satellites to orbit; after multiple successful launches, the team is targeting a commercial beta in late 2025 or early 2026. Net-net, Kuiper extends Amazon’s infrastructure moat while opening a new revenue stream that is naturally cross-sold with AWS.
Valuation: Is Amazon Stock Expensive?
I value Amazon on operating cash flow (OCF) and return on invested capital (ROIC), not GAAP earnings or near-term FCF that’s suppressed by the CapEx super-cycle. On those lenses, the setup looks attractive:
Cash engine > optics. Amazon generated $121.1 billion TTM OCF while deliberately front-loading CapEx for chips, data centers, power, and same-day logistics. If I proxy maintenance CapEx at 25% of Depreciation & Amortization ($12.4 billion), the underlying owner earnings are $108.7 billion. On today’s $2.44 trillion market cap, it means Amazon is trading for 22.5x owner earnings.
Mix shift to high-multiple businesses. The company’s two fastest growers –AWS (run rate $123 billion, $195 billion backlog) and Ads ($15.7 billion, +23% YoY) – carry structurally higher margins and capital turns than Retail. As these compound, the consolidated margin and return profile naturally steps up.
Temporary margin drag is by design. Depreciation from last year’s and this year’s builds is pulling down reported profitability now, but those assets monetize for years; as utilization climbs, unit costs fall and operating leverage kicks in (exactly what we saw post-COVID in logistics).
Multiple ways to win. Beyond core engines, options like Kuiper, Alexa+, Perishables retail, and Pharmacy aren’t in the base case but can add incremental value without requiring new capital structures.
Sanity check. I’m paying today for a business that throws off massive operating cash, is reallocating that cash into high-return capacity, and has visible, multi-year demand already contracted.
When I judge Amazon on cash generation and reinvestment returns rather than short-term suppressed FCF, the shares do not look expensive to me. The CapEx super-cycle is a feature, not an issue, of a model built to expand margins and cash flow over the next leg of growth.
My long-term investment thesis on Amazon remains intact. I took advantage of the March and April 2025 selloff to add to my position, and Amazon continues to be my largest holding and my highest-conviction business.
Final Thoughts
Amazon delivered a quarter that did exactly what management optimizes for: better inputs and faster systems driving durable outputs. Retail got quicker and cheaper, Ads scaled faster than Google and Meta, and AWS extended its lead while locking in $195 billion of future demand. The market’s fixation on AWS’s percentage growth misses the point: at a $123 billion run rate, the base effect is real, the bottleneck is supply (power), and Amazon is spending to remove it.
Crucially, Amazon’s capital posture is unique in Big Tech: no buybacks, no dividend, every dollar gets reinvested. That’s the opposite of Apple, Alphabet, and Meta, which returned $280 billion to shareholders over the last year. Yes, AWS margins ticked down, but that’s a feature, not a bug of an investment cycle that pulls forward depreciation and suppresses free cash flow now to expand capacity, drop unit costs, and widen margins later, the same playbook that turned COVID-era logistics spend into lasting efficiency.